
Key findings
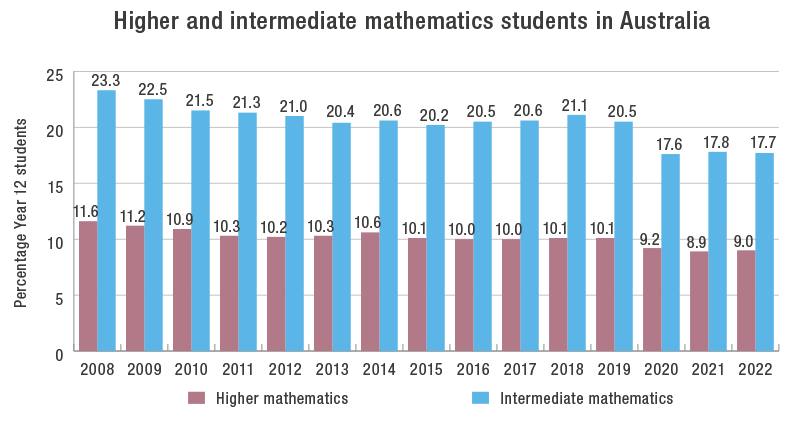
In 2020, the number of students studying calculus-based maths decreased significantly. Participation in higher mathematics dropped below 10% for the first time, to 9.2%. Participation in intermediate mathematics nosedived to 17.6%, well below its former usual participation rate above 20%. Since then, the number of students studying calculus-based mathematics has failed to recover, with participation rates of 8.9% and 9.0%, for higher mathematics and 17.8% and 17.7% for intermediate mathematics, in 2021 and 2022, respectively.
Both in the number of students as well as the proportion of the total student cohort, the participation in intermediate and higher mathematics subjects has plummeted to all-time lows in the last three years—significantly lower than the previous decade in which participation already could be described as minimal.
Altogether, in 2022 only 26.7% of students with a Year 12 qualification studied mathematics to at least intermediate level, compared to 30.6% in 2019 and 34.9% in 2008.
Only 37.5% of the students undertaking higher mathematics were female. In intermediate mathematics, the gender balance was even, with 50% female students. Around 52% of students completing Year 12 were female.
Introduction
The Australian Mathematical Sciences Institute (AMSI) has collected data on participation in mathematics subjects in Year 12 for many years. Collecting enrolment data in individual maths subjects is not just important to get a sense of how many students finish high school with some mathematics under their belt. It is also crucial to know at what level they study mathematics in Year 12 to know how prepared they are for tertiary study. What the AMSI data collection continues to show is that the proportion of students taking more advanced, calculus-based levels of mathematics as their “highest” maths subject has been in longstanding decline.
The latest data from 2021 and 2022 show that maths participation in Year 12 remains at all-time lows. It seemed that in the last decade or so Year 12 enrolments in calculus-based mathematics subjects remained stable – albeit at a low level – as a proportion of all students who complete high school exams. However, any hope of improving enrolment numbers has faded, as the three most recent years of data show that enrolments are at much lower levels than previously seen.
The number of students completing Year 12 with a secondary school certificate (such as the HSC in New South Wales, the VCE in Victoria and so on) grew in the decade to 2017 and has plateaued since then. In 2008, around 181K year 12 students completed school with a qualification. Since 2012, that number has exceeded 200K every year, with a peak of 219K in 2017. However, since 2017 the numbers have declined slightly, to 211K in 2022.
Between 2008 and 2021 the number of domestic students starting university has grown substantially, from 180K new bachelor students in 2008 to more than 259K in 2021. However, this commencing cohort dropped, by about 9%, to 236K in 2022. It is believed that this drop is related to effects associated with the COVID-19 pandemic and is not indicative of long-term trends.[i]
The number of domestic students embarking on an undergraduate STEM degree grew by 16% from 37K in 2008 to 43K in 2022. Over the same period international students undertaking undergraduate STEM degrees grew from 13K to 22K, an increase of 70%. Hence, the modest increase in domestic STEM students has been supplemented by a much larger rise in international students.[ii]
Higher and Intermediate Participation Rates
In most states a student enrolled in a higher-level study must also enrol in an intermediate level study. The data below represents the most advanced level that students were enrolled in. For example, an intermediate student is one who was enrolled in an intermediate level subject but not in a higher-level subject.
The NUMBER and PROPORTION of Australian higher mathematics students
| Year: | 2010 | 2011 | 2012 | 2013 | 2014 | 2015 | 2016 | 2017 | 2018 | 2019 | 2020 | 2021 | 2022 |
|---|---|---|---|---|---|---|---|---|---|---|---|---|---|
| # students | 21306 | 20422 | 20617 | 21189 | 21507 | 21665 | 21450 | 21855 | 20266 | 20265 | 19597 | 19239 | 18971 |
| Cohort size | 195526 | 198997 | 202970 | 206636 | 202867 | 213593 | 214709 | 219410 | 217643 | 200917 | 212021 | 215554 | 210719 |
| percentage | 10.9% | 10.3% | 10.2% | 10.3% | 10.6% | 10.1% | 10.0% | 10.0% | 10.1% | 10.1% | 9.2% | 8.9% | 9.0% |
The NUMBER and PROPORTION of Australian intermediate mathematics students
| Year: | 2010 | 2011 | 2012 | 2013 | 2014 | 2015 | 2016 | 2017 | 2018 | 2019 | 2020 | 2021 | 2022 |
|---|---|---|---|---|---|---|---|---|---|---|---|---|---|
| # students | 42070 | 42307 | 42605 | 42232 | 41756 | 43106 | 43957 | 45205 | 45924 | 41214 | 37319 | 38358 | 37332 |
| Cohort size | 195526 | 198997 | 202970 | 206636 | 202867 | 213593 | 214709 | 219410 | 217643 | 200917 | 212021 | 215554 | 210719 |
| % | 21.5% | 21.3% | 21.0% | 20.4% | 20.6% | 20.2% | 20.5% | 20.6% | 21.1% | 20.5% | 17.6% | 17.8% | 17.7% |
The total number of students in intermediate and higher maths peaked in 2018 before dropping significantly in 2019. For the most part, the 2019 drop in numbers could be explained by the fact that in one state the 2019 graduating cohort was smaller than normal – this did not affect the overall proportion of maths students.
Since 2020 the numbers and participation rates of higher and intermediate students have both significantly decreased. The 2022 participation in higher mathematics is now 9.0%, and in intermediate mathematics,17.7%. Both in the number of students as well as the proportion of the total student cohort the participation in these mathematics subjects is now at an all-time low – significantly lower than the previous decade in which participation already could be described as minimal.
Altogether, in 2022 only 26.7% of students with a Year 12 qualification studied mathematics to at least intermediate level, compared to 30.6% in 2019 and 34.9% in 2008.
Download PDF graph of students studying higher and intermediate mathematics in Australia
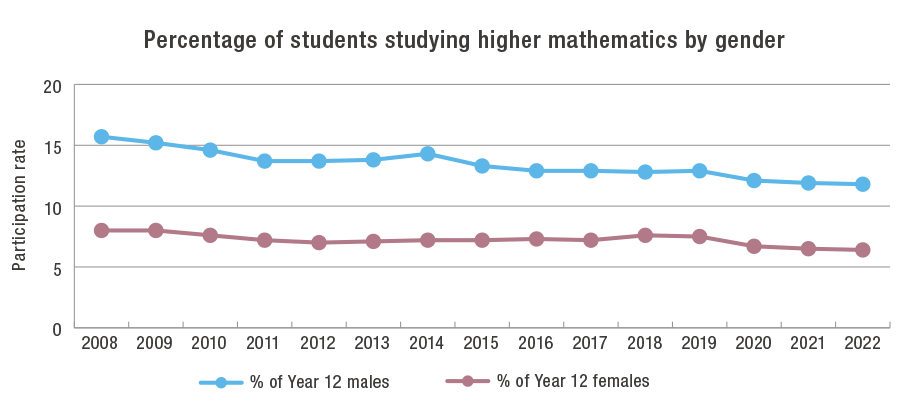
HIGHER MATHEMATICS PARTICIPATION BY GENDER[iii]
In 2022 only 37.5% of the students undertaking higher mathematics were female, which stands in stark comparison to the fact that there was a larger proportion of female students (nearly 52%) completing Year 12.
The NUMBER of female and male Australian higher mathematics students
| Year: | 2010 | 2011 | 2012 | 2013 | 2014 | 2015 | 2016 | 2017 | 2018 | 2019 | 2020 | 2021 | 2022 |
|---|---|---|---|---|---|---|---|---|---|---|---|---|---|
| female | 7894 | 7562 | 7422 | 7683 | 7663 | 7966 | 8174 | 8262 | 8550 | 7816 | 7402 | 7226 | 7106 |
| male | 13412 | 12860 | 13195 | 13506 | 13844 | 13699 | 13276 | 13593 | 13514 | 12449 | 12192 | 12008 | 11852 |
The female participation rate for higher mathematics studies was a paltry 6.4% in 2022 compared to rates of over 7%, prior to 2020. The male participation rate in 2022 was 11.8%, compared to rates of 13 or 14%, prior to 2020. Over the last decade, male participation has decreased more than female participation leading to a very slight narrowing of the gender gap in the last few years.
Download PDF graph of students studying higher mathematics
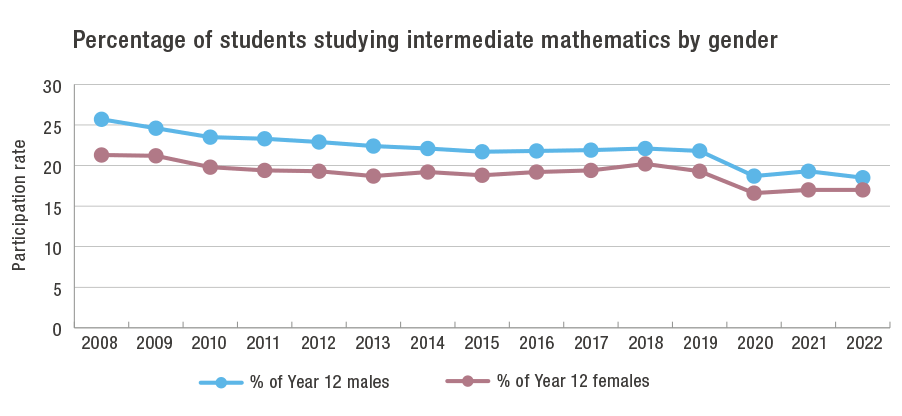
INTERMEDIATE MATHEMATICS PARTICIPATION BY GENDER
The overall participation rate for students studying intermediate mathematics was 17.7% in 2022, compared to rates of over 20%, prior to 2020. The female participation rate in 2022 was 17.0%, compared to rates of 19-21% prior to 2020. The male participation rate in 2022 was 18.5%, compared to rates of 20-22%, prior to 2020. The gender balance for intermediate mathematics has been nearly even over the last decade.
 Download PDF graph of students studying intermediate mathematics
The NUMBER of female and male Australian intermediate mathematics students
| Year: | 2010 | 2011 | 2012 | 2013 | 2014 | 2015 | 2016 | 2017 | 2018 | 2019 | 2020 | 2021 | 2022 |
|---|---|---|---|---|---|---|---|---|---|---|---|---|---|
| female | 20570 | 20489 | 20580 | 20231 | 20412 | 20856 | 21438 | 22122 | 22645 | 20257 | 18420 | 18802 | 18725 |
| male | 21500 | 21818 | 22025 | 22001 | 21344 | 22250 | 22519 | 23081 | 23272 | 20954 | 18889 | 19537 | 18569 |
Elementary Participation Rates
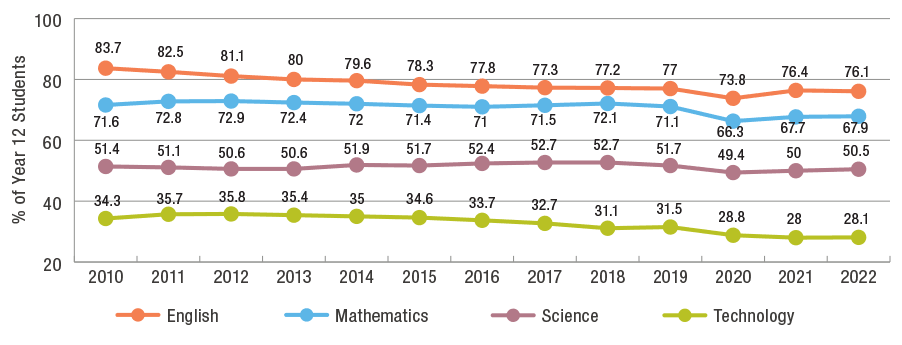
In the senior years of secondary schooling, participation in mathematics subjects that prepare students for tertiary study is in decline. While during the past decade typically around 71-73% of Year 12 students were enrolled in one or more mathematics subjects that count towards university or other tertiary admission, things took a turn for the worse in 2020 when only 66% of students took such a maths subject. Since then, numbers climbed slightly with close to 68% enrolled in at least one maths subject in 2021 and 2022.[iv]
Proportion of students taking a subject in Science, Mathematics, ICT & English[v]
The elementary category includes studies equivalent to both Essential and General Mathematics in the Australian curriculum. As with higher and intermediate maths, students may be enrolled in more than one subject. However, given the variety of elementary subjects in different states, it is not possible to reliably estimate how many students combine an elementary with an intermediate subject or are enrolled in two elementary subjects. In addition, some studies count towards the students’ ATAR scores, and some do not. In this section we therefore only include unadjusted enrolments in General Mathematics or equivalent, as these are generally counted towards the ATAR.
In 2022 there were 97K enrolments at the level of General Mathematics. The enrolment numbers have declined somewhat, from their peak of 109K in 2017. There have been changes to courses and assessment practices in the period 2016-2020. These along with other factors which cannot be determined from the data alone are likely to be responsible for the decline in numbers. In some states, the enrolment in Essential level mathematics (generally not counted towards the ATAR) seems to have increased to the detriment of General Mathematics, which warrants further investigation.
The NUMBER of Australian elementary mathematics students
| Year: | 2010 | 2011 | 2012 | 2013 | 2014 | 2015 | 2016 | 2017 | 2018 | 2019 | 2020 | 2021 | 2022 |
|---|---|---|---|---|---|---|---|---|---|---|---|---|---|
| # students | 102883 | 105870 | 107332 | 108154 | 103244 | 109225 | 107282 | 109330 | 99292 | 97752 | 98117 | 98431 | 96527 |
| Cohort size | 195526 | 198997 | 202970 | 206636 | 202867 | 213593 | 214709 | 219410 | 217643 | 200917 | 212021 | 215554 | 210719 |
| % | 52.6% | 53.2% | 52.9% | 52.3% | 50.9% | 51.1% | 50.0% | 49.8% | 45.6% | 48.7% | 46.3% | 45.7% | 45.8% |
HOW TO INTERPRET THE DATA
Since 2018 we classify the various senior secondary school mathematical studies offered in Australia as higher, intermediate and elementary levels of mathematics.[vi] The higher level is representative of the Australian Curriculum Level Specialist Mathematics, intermediate represents Mathematical Methods and elementary combines both Essential and General Mathematics.[vii]
Most states and territories broadly follow the Australian Curriculum, except for New South Wales. Note that we classify students from New South Wales who study at least Extension 1 as “higher” mathematics students, even though technically only students who study both Extension 1 and 2 are deemed fully equivalent to students of Specialist Maths in other states.[viii]
In this paper we have included data for all Year 12 mathematics students enrolled through the secondary boards of studies and the Australian International Baccalaureate (IB) in all states and territories, for the years 2008 to 2022. Keeping in mind that students often enrol in mathematics subjects at more than one level—for example in both an intermediate and higher maths subject – where possible we display the most advanced level of mathematics students have chosen, with overlapping enrolments in lower-level maths subjects taken out. The figures above therefore give the best indication of the level of preparedness of students to enter university degrees—especially degrees with a mathematical component such as science, engineering and commerce.
In previous AMSI publications of Year 12 participation data the proportion of students was calculated as a percentage of the Year 12 population eligible to complete examination. After review of our data collection, we are now calculating it as a percentage of Year 12 students that have completed the secondary school examination in their state or territory. While this means that the historical collection of enrolment numbers has remained the same, the calculated percentages can no longer be compared with earlier publications on this subject.
Professor Tim Marchant and Sophie Kennedy
References
[I] https://www.education.gov.au/higher-education-statistics/student-data
[ii] https://www.education.gov.au/higher-education-statistics/student-data
[iii] Male and female participation is currently reported on due to availability of data. We hope to include non-binary participation data in the future.
[iv] https://www.acara.edu.au/reporting/national-report-on-schooling-in-australia/year-12-subject-enrolments
[v] This graph represents the proportion of students taking at least one subject in the learning areas of Science, Mathematics and Information and Communication Technology and English. It does not specify enrolments in individual subjects in each learning area.
[vi] Previously AMSI referred to advanced, intermediate and elementary. We adjusted the terminology to avoid confusion with the New South Wales subject Advanced Mathematics, which we classify as intermediate.
[vii] https://australiancurriculum.edu.au/senior-secondary-curriculum/mathematics/
[viii] https://www.uac.edu.au/future-applicants/admission-criteria/year-12-qualifications

