


Year 8
Number and Algebra
Plotting linear relationships and examples of linear relations
Students should first plot points. In year 8, they plot points from tables of values of both functions. It is possible to introduce the concepts of gradient and y-intercept at this level.
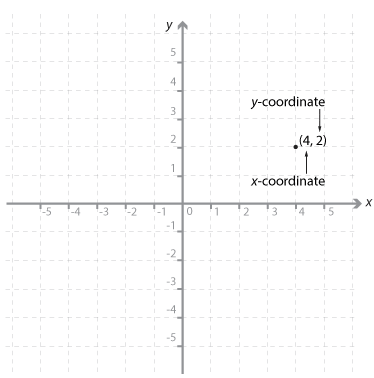
The number plane (Cartesian plane) is divided into four quadrants by two perpendicular axes called the x-axis (horizontal line) and the y-axis (vertical line). These axes intersect at a point called the origin. The position of any point in the plane can be represented by an ordered pair of numbers (x, y). These ordered pairs are called the coordinates of the point.
The point with coordinates (4, 2) has been plotted on the Cartesian plane shown. The coordinates of the origin are (0, 0).
Plotting points
We can plot sets of ordered pairs and look at the patterns that emerge.
Example 1
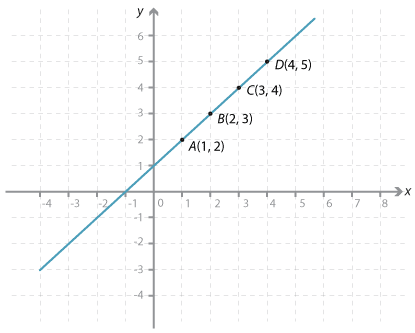
First the points (1, 2), (2, 3), (3, 4), (4, 5) are plotted.
We can draw a straight line through these points, and we can see that as the x-value increases by one the y-value also increases by one.
Two important properties of straight lines will be looked at in this resource:
- the gradient (steepness of the line)
- the intercepts with the axes.
We will also discuss the necessary and sufficient properties to define a straight line.
The points plotted here can be generated from the rule y = x + 1. The gradient is 1, the x-axis intercept has coordinates (−1, 0) and the y-axis intercept has coordinates (0, 1).
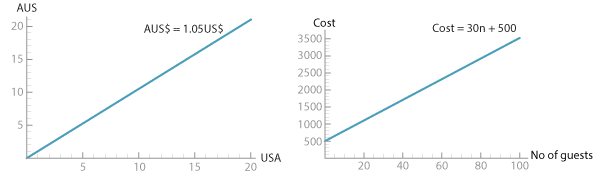
Many situations can be modelled by a set of points that lie in a straight line. Two examples are given here. One is a currency conversion graph that allows us to readily convert sums of money from US dollars to Australian dollars, and the second a graph of the cost of production where there is a fixed cost plus a fixed cost per item. For example, the cost of a party is $500 for the hire of the hall and $30 per invitee (n).
Example 2
Consider the set of points (–2, 4), (–1, 1), (0, 0), (1, 1), (2, 4), (3, 9).
We cannot join these points in a straight line. These points all lie on the parabola y = x².
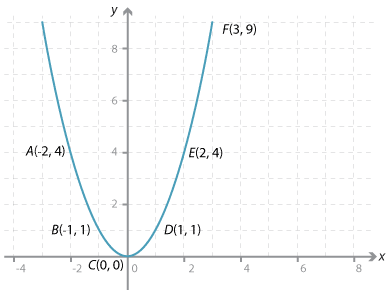
It is not surprising that all sets of coordinates generated by an algebraic rule do not lie on a straight line.
Non-linear relationships are discussed in greater detail in other modules.
 |
This publication is funded by the Australian Government Department of Education, Employment and Workplace Relations |
Terms of use |