The Improving Mathematics Education in Schools (TIMES) Project
Data Investigation and interpretation
Statistics and Probability : Module 4![]() Year : 6
Year : 6
June 2011

It is assumed that in Years F-5, students have had many learning experiences involving choosing and identifying questions or issues from everyday life and familiar situations, and planning statistical investigations that involve categorical, count or measurement data, but in which the focus in exploration and comment is on each set of data by itself. For example, if data are collected on students’ favourite TV show and favourite holiday activity, then before Year 6, the data on TV shows are explored separately to the data on holiday activities.
It is assumed that students have had learning experiences in recording, classifying and exploring individual datasets of each type - categorical, count and measurement data - and have seen and used tables, picture graphs and column graphs of categorical data and of count data with a small number of different counts treated as categories, and dotplots of measurement and count data.
Statistics and statistical thinking have become increasingly important in a society that relies more and more on information and calls for evidence. Hence the need to develop statistical skills and thinking across all levels of education has grown and is of core importance in a century which will place even greater demands on society for statistical capabilities throughout industry, government and education.
A natural environment for learning statistical thinking is through experiencing the process of carrying out real statistical data investigations from first thoughts, through planning, collecting and exploring data, to reporting on its features. Statistical data investigations also provide ideal conditions for active learning, hands-on experience and problem-solving.
Real statistical data investigations involve a number of components: formulating a problem so that it can be tackled statistically; planning, collecting, organising and validating data; exploring and analysing data; and interpreting and presenting information from data in context. A number of expressions to summarise the statistical data investigative process have been developed but all provide a practical framework for demonstrating and learning statistical thinking. One description is Problem, Plan, Data, Analysis, Conclusion (PPDAC); another is Plan, Collect, Process, Discuss (PCPD).
No matter how it is described, the elements of the statistical data investigation process are accessible across all educational levels.
In this module, in the context of statistical data investigations, we introduce situations involving at least two categorical datasets on the same subjects. To do so, we also introduce for students the concept of a statistical variable because this makes it easier and clearer that we are talking about data on at least two categorical variables on the same subjects. We explore pairs of categorical variables, including the possibility of association between them. Because categorical data can arise in so many real situations, issues or questions involving categorical variables are readily found in a wide variety of media reports and other secondary sources. Hence understanding, interpreting and questioning representations and comments on categorical data are important in development of statistical literacy and statistical thinking.
In Years 4 and 5 we have considered different types of data. When we collect or observe data, the ‘what’ we are going to observe is called a statistical variable. You can think of a statistical variable as a description of an entity that is being observed or is going to be observed. Hence when we consider types of data, we are also considering types of variables.
In categorical data each observation falls into one of a number of distinct categories. Thus a categorical variable has a number of distinct categories. Such data are everywhere in everyday life. Some examples of pairs of categorical variables are:
- gender and pet preference between cat and dog
- favourite TV show and favourite holiday activity
- gender and favourite food
- favourite sport and colour of hair (e.g. redhead, blonde, brown, black)
Sometimes the categories are natural, such as with gender or preference between cat and dog, and sometimes they require choice and careful description, such as favourite holiday activity or favourite food.
This module uses a number of examples to illustrate these different types of data and to develop the statistical data investigation process through the following:
- considering initial questions that motivate an investigation;
- identifying issues and planning;
- collecting, handling and checking data;
- exploring and interpreting data in context.
Such phases lend themselves to representation on a diagram, as follows.

The examples consider simple situations familiar and accessible to Year 6 students
and in reports in digital media and elsewhere, and build on the situations considered in F- 5. The module also includes tips on possibly misleading aspects of representations of categorical data.
Initial questions that can motivate an
investigation involving at least two categorical variables
The following are some examples of questions that involve collecting, or accessing, or finding, and investigating data for at least two categorical variables.
- A
- There are pictures that can be looked at in two ways. For example, there is a well-known old man/young man optical illusion.

Which one do you tend to see? Do boys and girls tend to differ in which one they can see first? - B
- When you clasp your hands, which thumb is on top? Are boys and girls different in the way they clasp their hands? When you fold your arms, which arm is on top? Does this seem to relate to which thumb is on top when you clasp your hands?
- C
- Do girls prefer dogs or cats for pets? Are girls’ preferences between cats and dogs different to boys? Where do people get their cats and/or dogs?
- D
- Why does Queensland not have daylight saving in summer? What do you know about what surveys of Queenslanders showed?
- E
- Governments and the Cancer Council and other groups run advertisements, especially in summer, to try to get people to protect their skin from the effects of exposure to sun. For example, in November 2009, the campaign for summer 2009-2010 was launched at Bondi Beach, with towels on the beach representing the Cancer Council’s estimates of the number of Australians who would die from skin cancer in the next year. Do people tend to heed the Slip, Slop, Slap messages? Are adults different to teenagers?
- F
- On paths or tracks that are used by both cyclists and pedestrians, do male and female users tend to be different in whether they are cycling, walking or jogging?
The above are examples of just some of the many questions that can arise that involve data on at least two categorical variables. Some of these questions are used here to explore the progression of development of learning about data investigation and interpretation. The focus in this module in exploring and interpreting is on categorical variables and pairs of categorical variables and the possibility of association between them.
General statistical note for teachers
The general meaning of association between statistical variables refers to probabilities and statistical dependence. If statistical variables are associated or dependent, then the chances of the values of one are not the same for different values of the other. For categorical variables with just two categories for each variable, this is easy to express.
For example, if preference for dog or cat is associated with gender, then the chance that girls prefer cats is different to the chance that boys do. Hence if gender and pet preference are associated, and we collect data on these two variables, we would expect to see a different pattern in the frequencies of preference of cats and dogs between boys and girls.
However, we have to be very careful in commenting on data. We have to allow for random variation and we may need lots of data even just to say that the data indicate association.
Identifying issues and planning
In the first part of the data investigative process, one or more questions or issues begin the process of identifying the topic to be investigated.
In thinking about how to investigate these, other questions and ideas can tend to arise. Refining and sorting these questions and ideas along with considering how we are going to obtain data that is needed to investigate them, help our planning to take shape. A data investigation is planned through the interaction of the questions:
- ‘What do we want to find out about?’
- ‘What data can we get?’ and
- ‘How do we get the data?’
Planning a data investigation involves identifying its variables, its subjects (that is, on what or who are our observations going to be collected) and how to collect or access relevant and representative data.
Example A: optical illusions
There are two variables in these questions: which picture is seen first and gender of the person looking at the picture(s). Which picture is seen first is of interest on its own. The second question is asking if there is a connection or association between this variable and gender of observer.
Data for this investigation is straightforward and quick to collect to obtain many observations and can be collected from fellow students and from family and friends.
A brief explanation should be given to each subject (for example, 'do you see an old or young man in this picture?') but their first response is what should be noted.
Example B: clasping hands and folding arms
The questions in this example involve at least three categorical variables for each
person questioned:
Which thumb is on top when the subject’s hands are clasped?
What is the gender of the subject?
Which arm is on top when the subject’s arms are folded?
An investigation to explore these questions might include other variables (such as which hand is dominant) and could include design issues (such as which action is performed first and should this be randomised), but the three named variables above are the variables of the original questions. The motivation for these questions comes from observation that most people tend to do these actions the same way each time and it can be surprisingly difficult to clasp hands or fold arms so that the other thumb or arm is on top. There may be a genetic link in these simple actions. See, for example, https://humangenetics.suite101.com/article.cfm/dominant_human_genetic_traits which includes the following statement:
'Clasp your hands together (without thinking about it!). Most people place their left thumb on top of their right and this happens to be the dominant phenotype. Now, for fun, try clasping your hands so that the opposite thumb is on top. Feels strange and unnatural, doesn’t it?'
It should be noted (see General statistical notes below) that many observations need to be collected to assess the statement in the quote above. The data are straightforward and quick to collect for many students, and if these questions are investigated by students collecting their own data, as many observations as possible should be collected.
The questions in this example relate to two variables on their own, namely, which thumb is on top and which arm is on top, and also to possible connections or associations between these variables themselves, and between each of these variables and gender.
Example C: Cats and dogs
Three questions have been expressed in this example in the introduction:
The first is asking about people’s preferences between cats and dogs for pets, and so asking each person in a sample of people about one variable.
The second is asking if this preference is different for boys and girls, so is asking if there is any connection or association between preference and gender.
The third is asking about another variable, namely the source of pets.
However it is asking about the source of both cats and dogs so the source needs to be considered in association with the type of pet.
The first question is referring to people in general but the second is referring to boys and girls. This second question could be generalised to males and females and refer to people in general, or we could decide we are going to focus on young people − on boys and girls. The third question is referring to pets rather than people, so it could be included in a survey of boys and girls, but it would refer only to the pets of families with children and not to cats and dogs as pets of people in general. There is no problem with this provided it is made clear in any reporting. That is, all reports of data investigations must include good information on how the data were collected or obtained, so that any recipient of the report has the information that allows interpretation of who or what the data are representative.
Hence a data investigation could be carried out by a survey of students in the school, recording their gender, their preference for cats or dogs as pets (cat, dog, neither, either), and, if they have a cat or a dog, where did they get it.
Alternatively, or in addition, the possibility of the existence of relevant data collected by others could be investigated − that is, the existence of relevant secondary data could be investigated. In particular the third question might be one for which there are data available. In this case, the data investigation could consist of two parts: a survey of students, and consideration of data collected by others. It must be emphasized that there would be two sets of data in such an investigation, obtained under different conditions and possibly referring to different general situations.
Example D: daylight saving
Although students can collect opinions on the question of daylight saving, this question lends itself to investigating data that have been collected. What surveys have been done and what data are available?
Example E: the effect of the Slip, Slop, SlAp messages
As with example D, this question is one for which there are likely to be secondary sources of data. Students may like to ask their classmates and other students in the school about what they do to protect their skin, but the possible responses are not simple and there is much that can be learned from discovering how such questions are investigated by authorities. Asking what students do may be more useful as background to investigating secondary sources of data and in discussion after such data are found and discussed.
Example F: cycle/pedestrian paths
This example involves two categorical variables, transport type and gender of path user, although an investigation might include more information. Type of transport is of interest by itself, and its possible association with gender is the other question of interest. Students could collect data to investigate these questions, possibly on different paths for further interest, but there are some data collection issues to be considered (see next section). Alternatively, there may be secondary data sources available. However secondary sources of data usually provide only data summaries, and to consider the question of association, such sources must provide summaries that specifically address this question.
General statistical notes for teachers’ background information
To investigate questions about categorical data, many more observations are required than is often realised. Categorical data are usually used to estimate and/or compare proportions of categories of interest.
For example, what proportion of people overall have their left thumb on top when they clasp their hands? To estimate a proportion with reasonably high confidence to within 0.05 of its true value can require up to 400 observations if the true value of the proportion is close to 0.5. Fewer are required if the true value of the proportion is closer to 0 or 1; for example, if the true value we are trying to estimate is 1/3, then we require approximately 350 observations to estimate it with high confidence to within 0.05 of its true value. To estimate a proportion with reasonably high confidence to within 0.01 of its true value can require up to 10,000 observations. To estimate it with reasonably high confidence to within 0.1 can require up to 100 observations.
Estimating to within 0.1 means that if we obtain 55% of our subjects who, for example, have their left thumb on top when they clasp their hands, then all we can say is that we are reasonably confident that the true value lies somewhere between 45% and 65%.
Although students do not need to know the above details until senior or tertiary studies, it is valuable for teachers to know so that they can help in developing and guiding students’ notions of variation across datasets and uncertainty in thinking beyond the data 'in hand' to a more general situation of which we may consider the data to be representing.
Note that the true value of the proportion referred to above is for the general situation or population for which our data are representative.
Collecting, handling and checking data
As in Years 4 and 5, the examples below include illustrations of the first few rows of suggested recording sheets. The following note is very helpful in planning and preparation for collecting data.
General statistical note
Note in the examples in Year 5, and in the examples below in which data are collected (rather than obtained from a secondary source) how the subjects and variables of a statistical data investigation can always be represented by a recording sheet or spreadsheet with rows and columns, where each subject has a row and each variable has a column, and the column names identify the variables. That is, each time we collect or take an observation, we enter data in one of the rows, corresponding to one subject. If we are collecting or observing three observations per subject, we have three bits of data to enter, one in each column.
For example, if we are asking students for their favourite TV show and favourite holiday activity and we are also recording whether they are boy or girl, we would have 3 observations for each student and hence 3 columns. We might include another column in the recording sheet with the student’s name (or in general, some identifier) so that we can check the data if necessary or to avoid duplicates.
Example A: optical illusions
Apart from being consistent in giving a brief explanation to each subject (for example, 'Do you see an old or young man in this picture?') and recording their first response, there are few problems in collecting these data. The first few rows of the raw recording sheet would look like:
| Student name | Gender | Picture seen first |
| Frances | G | Y |
| Stefan | B | Y |
| Alisha | G | O |
Example B: clasping hands and folding arms
If it is decided to ask each person to clasp their hands first and then fold their arms, there are just three variables to be recorded for each person surveyed: gender, top thumb in clasped hands (R/L), and top arm in folded arms (R/L).
If it is decided to randomise the order in which subjects are asked to clasp hands and fold arms, then the order of the actions should also be recorded in case it turns out to be important. There is no way of knowing if it is important or not without carrying out an investigation into this question!
If the same order is used, the first few rows of the recording sheet for the raw data would look like the following, with each row corresponding to a person surveyed, and the three columns named by the three variables, and with observations recorded for each subject:
| Student name | Gender |
Thumb on top in clasped hands |
Arm on top in folded arms |
| Alice | G | L | L |
| Jeremy | B | L | R |
| Jane | G | R | L |
Note that the column with identifiers of subjects is not necessary, but in practice may help in avoiding duplication and in checking data for mistakes or problems.
If the order of the actions is randomised (for example, by tossing a coin), another column is needed, headed 'first action' with entries of 'clasping hands' or 'folding arms', perhaps abbreviated to C and F.
Example C: cats and dogs
Boys and girls and their preferences between cats and dogs as pets.
Asking fellow students their preferences between cats and dogs as pets and recording if they are boy or girl is fairly straightforward once the categories for responses are decided − for example, are we going to allow the response of 'either' or 'I like both' or are we going to ask that the choice be made.
The recording sheet for this is simple and the first few rows would look like the following table. Notice that recording the names is not necessary for the data set but can be useful in avoiding duplication.
| Student name | Gender | Preference |
| Abigail | G | D |
| Fred | B | C |
| Jenny | G | D |
Sources of dogs and cats acquired as pets
As described above, students with dogs and/or cats as pets could be asked where did their pet come from, but this information refers only to pets of families with primary school age children. Also, if a family has more than one of either dog or cat or both, the source of one pet in a family is likely to be affected by the source of another pet.
A report on the results of a survey conducted in Victoria in 2004 is available here
The specific purpose of this survey was to:
- Determine the sources of acquisition of dogs and cats;
- Determine the age of pets at time of acquisition; and
- Identify the existence of health problems in cats and dogs when acquired
The questionnaire was designed in consultation with organisations involved in animal welfare, and the survey was then distributed, via a number of different organisations, to members of the general community to complete. Most of the surveys (76.1%) were distributed through veterinary clinics to animal owners; the next major source (11.4%) was through local council events or council reception desks. We will focus here on the data reporting sources of acquisition of dogs and cats.
The raw data sheet for sources of dogs and cats would have a column named 'type of pet' (cat or dog) and a column named 'source'. Each row would correspond to a single pet − either a dog or a cat. Note that the different possible categories for the observations on 'source' would need thought and possibly some researching.
The report does not consider if there are multiple responses from pet-owners. That is, although the data are representative of a much wider group than of families with primary school age children, the report does not comment on the second consideration above (namely, the extent to which multiple responses from a pet-owner relate to each other).
Example D: why does Queensland not have daylight saving in summer?
A referendum was held on 22nd February in 1992 in Queensland after a three-year trial. Following petitions asking for daylight-saving to be introduced or another referendum held, the Queensland government in 2006 commissioned research into the issues. The report from this can be seen here.
The results of the 1992 referendum by state electoral seat can be found on the internet and were summarised in 2010 here.
The problem for Queensland is that the further south and east you went the higher the ‘Yes’ vote in 1992; the further north and west the higher the ‘No’ vote in 1992.
In gathering data such as these, there are two variables to be observed for each person surveyed: location and opinion. Hence a raw data recording sheet would have two columns, with each row corresponding to a person. Of course only summary data would be reported.
Example E: the Slip, Slop, Slap message
The challenge in this general issue or topic is to investigate people’s behaviour and attitudes to sun protection, including whether people get sunburnt or attempt to tan. The difficulties in asking questions relating to people’s behaviour are that behaviour tends to vary from day to day and to depend on many individual influences. Interpretations of questions can also cause problems. For example, a question such as 'Do you wear a hat when outside in summer?' is too vague for people to answer in a way that is consistent across everyone.
The National Sun Protection Survey of 2006-2007 was the second such survey; the first was conducted in 2003-2004. The study is funded by the Cancer Council Australia and the Australian Government through Cancer Australia. The 2006-2007 survey reached respondents through phone interviews conducted on Monday and Tuesday evenings during summer. The interviews focussed on weekend behaviour in summer, and also recorded whether the person was an adolescent or an adult, and in which state they lived. These questions give data for three categorical variables for each person: sun protection behaviour on the weekend; age group; and location (state where they live). Some of the results are considered below.
Example F: cycle/pedestrian paths
Planning a data investigation on use of a cycle/pedestrian path involves quite a lot of decision-making. Apart from deciding on location and time (day of week, time of day), there is also the vexing question of whether to consider individuals or groups as the subjects − because usually (but not always) members of a group are using the same mode of transport. As always, the most important aspects of such questions are discussion, decision and description of how, when and where the data are collected.
If gender is to be recorded, then the data must be observed per user, whether in groups or not.
Exploring and interpreting data: frequencies
All the data in these examples are categorical data. We therefore use tables and column graphs (which are also called barcharts) to summarise and explore the data. As seen in Years 4 and 5, categorical data are summarised by the frequencies of occurrence of the categories.
Reminder: Frequencies of categories are the numbers of observations in the data that
fall into each category. It is frequencies that provide the information on how likely are
the different categories − which tend to occur more frequently and which tend to occur less frequently.
However, we are now also interested in looking at observations of more than one aspect of subjects to see if there is some association between these aspects. That is, we are also now interested in looking at data on two categorical variables together. We summarise data collected simultaneously on two categorical variables in 2 × 2 tables and in side-by-side column graphs.
Example A: optical illusions
203 students were shown the optical illusion picture and asked whether they could see an old or a young man. Below is a 2 × 2 table summarising the 203 responses by whether the old or young man was seen first and whether the student was a boy or girl. Hence overall there are four categories: boy and see old man; boy and see young man; girl and see old man; girl and see young man. The response of each student surveyed appears in one and only one of these four categories. These categories are called joint categories because they are formed by considering together (or jointly) the gender of the student and which picture they saw first. The total numbers of each of the separate categories − boy, girl for gender, and old man, young man for picture seen − are also often given in such tables.
Table of picture seen first in optical illusion and gender of subject
| Sees old man | Sees young man | Total | |
| Girl | 47 | 64 | 111 |
| Boy | 42 | 50 | 92 |
| Total | 89 | 114 | 203 |
The column graph below represents the frequencies given in this table. It is called a side-by-side column graph because for each of old and young man picture, it gives the frequencies of boys and girls who saw this picture first, side-by-side.
graph of picture seen and gender

Notice that the observations can be split first by either of the variables. In this example, either of the above graphs clearly show the main features of the data, namely that for both boys and girls in this group, the young man was more often seen first in the optical illusion picture, and that in this group, the girls tended to see the young man rather than the old more often than the boys.
However, the second graph above is the more appropriate, as it better represents the data collection, namely, boys and girls were shown the picture and asked which did they see (old man or young man). The first graph tends to represent looking at those who saw the old man first and asking/classifying them as boy or girl.
If there is association between gender and the picture seen first, we would expect the pattern of frequencies over old and young to be different for boys and girls. In these data, there is an indication that for boys, there’s not much difference between seeing old or young first, but the data indicate that girls may tend to be more likely to see the young man than the old. But, at this stage of development and with only 111 girls asked, all we can say is that in this group the girls tended to see the young man more often than the old.
Example B: Clasping hands and folding arms
The same group of 203 students were also asked to clasp their hands and fold their arms. Which thumb was on top when the hands were clasped and which arm was on top when the arms were folded were recorded along with gender. The two tables below are each
2 × 2 tables: the first looks at which thumb is on top in clasping hands; the second looks at which arm is on top in folding arms.
In this group, we see that there are more with left thumbs on top than with right, but the difference is perhaps not as much as people might think from the impression of the article here.
It is of interest and benefit to encourage students to discuss this without any directions or suggestions. The article says 'most people place their left thumb on top of their right' when clasping hands. So in a group of 203 students how many would the students in your class expect to have their left thumb on top?
Table of thumb on top and gender of subject
| Left | Right | Total | |
| Girl | 65 | 46 | 111 |
| Boy | 51 | 41 | 92 |
| Total | 116 | 87 | 203 |
In this group of 203 students,  (which is approximately 57%) placed their left thumb on top. So this is more than half but not much more. If we survey lots of groups of 200 people (taking 200 for convenience!) what sort of numbers out of 200 would the students in your class expect to see with left thumb on top if the article is correct?
Table of arm on top and gender of subject
| Left | Right | Total | |
| Girl | 61 | 50 | 111 |
| Boy | 60 | 32 | 92 |
| Total | 121 | 82 | 203 |
So more than half this group placed their left arm on top when they folded their arms.
The column graphs below present the data in these tables graphically.
graph of gender, thumb on top

graph of gender, arm on top

We see from the graphs that in this group, girls had a slightly greater tendency than boys to place their left thumb on top. Boys and girls tended to place their left arm on top in folding their arms, but the boys had a greater tendency towards this than the girls in this group.
A question that arises is, 'Does there tend to be any association between which thumb is on top in clasping hands and which arm is on top in folding arms?' To investigate this we must consider the data for thumb and arm together. The table and graph below present this combination of the data for boys and girls combined.
Table of arm and thumb on top
| Arm on top | |||
| Thumb on top | Left | Right | Total |
| Left | 61 | 56 | 117 |
| Right | 60 | 26 | 86 |
| Total | 121 | 82 | 203 |
graph of thumb on top, arm on top

If the left thumb is on top, there is no leaning towards left or right arm on top. If the right thumb is on top, the left arm is more likely to be on top. This may reflect an overall leaning towards having the left arm on top.
This topic naturally leads to more questions that could be investigated such as 'Do people tend to clasp their hands and fold their arms the same way each time they do this?' and 'does it matter whether we ask people to clasp their hands first or fold their arms first?' However such questions require much more thought and more maturity in statistical thinking to investigate.
Exploring and interpreting data: percentages
We can see from the above examples that we are starting to want/need to talk in terms of percentages or relative frequencies of observations.
Relative frequencies of categories are the fractions or proportions of observations in the data that fall into each category. Relative frequencies not only provide the information on how likely are the different categories, but also facilitate comparisons across groups of frequencies within the groups. For example, in the above examples we are interested in how the overall proportion of students who placed their thumb on top in clasping hands compared with half. We are also interested in how the proportion of girls who placed their thumb on top compared with the proportion of boys who placed their thumb on top.
The most common form of expression of such relative frequencies in the media and public reports is through percentages.
Example B: Clasping hands and folding arms
The table of gender and thumb on top is revisited below but with approximate percentages instead of frequencies. These percentages are of the 203 students in the different categories.
Table of percentages of thumb on top and gender of subject
| Left | Right | Total | |
| Girl | 32% | 23% | 55% |
| Boy | 25% | 20% | 45% |
| Total | 57% | 43% | 100% |
Note that we no longer have any information about the numbers of students surveyed.
If we want to compare girls and boys in this group, we can calculate the percentages of each gender who placed their thumb on top. We can present these in the following table. Note that in this table, not only do we have no information about the overall numbers surveyed but we also have no information about the proportions of girls and boys in the group. However, we can easily compare the boys and girls with respect to whether they place their left or right thumb on top.
Table of percentages of girls
and of boys with thumb on top
| Left | Right | Total | |
| Girl | 59% | 41% | 100% |
| Boy | 55% | 45% | 100% |
| Total | 57% | 43% | 100% |
Another form of column graph that can be useful when the focus is on comparing relative frequencies across different groups is the stacked column graph. The graph below shows this for the boys and girls and whether they placed their thumb on top.

Notice that the actual frequencies are retained so we can see that we have more girls than boys in this group. But we can also readily see that the relative frequency of thumb on top for the girls is greater than the relative frequency of thumb on top for the boys. The graph does not give us the percentages but, on the other hand, it does not hide the numbers of observations. Although it is not easy to get the exact frequencies in each group, it does provide an easy-to-see picture of the comparison between the boys and girls. We see instantly that there are more girls than boys in this group and that the girls had a greater tendency to place left thumb on top than the boys.
Exploring and interpreting data : secondary sources of data
Most reports of categorical data are given in terms of percentages. Such reports should be very clear on how the data were collected and should provide information on numbers of observations. But almost always the comments in the reports refer to percentages so it is important to understand what the percentages refer to (that is, of what totals are the percentages taken) and how to interpret them.
Example C: cats and dogs as pets
The following graph is from Pawsey (2005)
percentage of cats and dogs
obtained fRom different sources
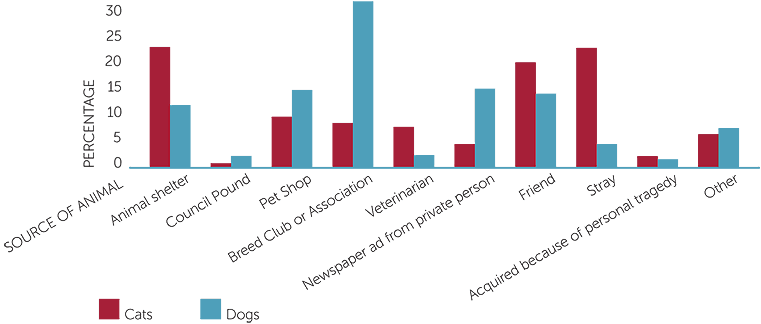
This shows a side-by-side column graph of percentages. It is not completely clear from the graph what the percentages refer to, but the text in the paper enables the reader to see that the percentages are of sources of cats and sources of dogs separately. The text also states that information was obtained for 1396 cats and 1756 dogs in Victoria from April to December 2004.
The text in the paper after this graph gives the values of the percentages in the above graph in a summary that compares the sources of dogs and cats as pets.
From graph 2 it can be seen that the major sources for acquisition of dogs and cats vary considerably between the two species. The most common source of dogs was through breeders (30%), while this was one of the smaller sources of cats with only 8% of cats acquired in this manner. Cats were most commonly acquired through three major sources, animal shelters, adoption of a stray cat (both 22%) or from friends (19%). Whilst in contrast only 11%, 4% and 13% respectively of dogs were acquired through these same sources. Pet shops supplied 14% of dogs and 9% of cats to pet owners and along with newspapers (14%) and friends (13%) were the next major sources of dogs after breeders. Interestingly only a small number of cats (4%) are sourced through newspapers. Council pounds and acquisition due to personal tragedy were the least common sources for both cats and dogs accounting for only 1-2% of both types of pets.
Pawsey (2005)
The above is a good example of reporting data on two categorical variables, one of which has natural categories (cat, dog) and the other is a more complex variable (source), whose categories require careful thought and description. How the data were collected is carefully described, and the numbers of observations given as well as the percentages. A criticism is that it should be more clearly stated that the percentages in the graph are of two different groups − one set of percentages of the cats, and the other of the dogs.
Example E: the Slip, Slop, SlAp message
The summary of key findings of the National Sun protection Survey of 2006-2007 may be found here.
The National Sun Protection Survey investigates people’s sun-related knowledge, attitudes and behaviours. The 2006-2007 survey was carried out by telephone interviews on Monday and Tuesday evenings over summer and asked about weekend behaviour. There were 5085 adults (18-69 years) and 652 adolescents (12-17 years) in Australia interviewed. The results of the survey are given in terms of percentages. For example, the report gives percentages of adults and adolescents who, when outdoors in peak UV hours on weekend, used head wear (50% and 29%); used sunscreen (37% of both groups); wore ¾ length or long sleeved tops (27% and 20%); got sunburnt (14% and 24%); and attempted a tan (11% and 22%).
Notice that these are percentages of two separate groups (adults and adolescents) so that one of the categorical variables being considered is age group, but the percentages add to more than 100% for each age group because respondents are asked to say yes to any of the behaviours described. For example, an adult respondent might respond yes to the first three behaviours and hence contributes to all three quoted %’s. The second variable 'sun behaviour when outdoors in peak UV periods on summer weekends' is categorical but the survey is permitting multiple responses to it. There is no way of knowing from the quoted results what the frequencies are for the various combinations of behaviours. This is why the focus of the report is on the % who attempted a tan or the % who got sunburnt − and there is no way of knowing how much these overlap or not without access to the original raw data giving the responses per person.
The survey report also gives percentages of adults in each Australian state and territory who attempted a tan, and who got sunburnt on a summer weekend. But the report also includes a very interesting statement: 'state breakdowns of tanning attempt and sunburn incidence amongst teenagers is not available due to the smaller sample size'. That is, 652 teenagers split by state give numbers considered to be too small for quoting %’s. This gives some idea that many observations are needed to be able to quote %’s that can be regarded as reasonable estimates for populations from which the data are obtained. The report also estimates the number of adults in each state who got sunburnt on a summer weekend − these are not the number who did get sunburnt. They are simply the percentages obtained from the survey multiplied by the adult population of each state at that time and are quoted in a report for public consumption for impact. Do you think this is a good idea?
Tips on finding misleading representations of categorical data
One of the most over-used representations of categorical data is the pie graph. It is also one of the most misused graphs and many statisticians advocate avoiding the use of it altogether. The following sketch reflects these thoughts.

A pie graph is a circle in which the areas of the pieces of pie represent the frequencies of the categories, and hence also the relative frequencies and their corresponding percentages because the area of the pie is apportioned relatively. Even when correctly used, pie graphs have limitations. These include:
- the risk of optical illusions in the choice of colours;
- a pie graph can only be used for one categorical variable at a time;
- areas of a pie graph are not as readily accessible as the heights of bars in a column graph.
Pie graphs are also often incorrect or misused. Examples include:
- incorrect use for sets of values of measurement data;
- %’s not adding to 100%;
- no frequencies or %’s given on the graph. This also illustrates one of the limitations of pie graphs as the frequencies/relative frequencies are not readily accessible from the picture alone;
- use of a spurious third dimension so that nothing in the picture represents the frequencies/relative frequencies;
- use of 'doughnut' pie graphs (with or without the incorrect third dimension) leading to optical distortion.
The two graphs below illustrate misuse of pie graphs.
(Michael: please insert source file here and small to save two pages, if possible.)

The inclusion of a useless third dimension resulting in distortion of the graph is also seen in column graphs; 3-dimensional column graphs should never be used.
Another graphical mistake is not having the vertical scale on column graphs starting at 0 because it is the height of the column that represents the information.
Other misleading graphics are associated with optical illusions, including the use of pictorial representations instead of columns of equal width. The widths of the columns in a column graph have no meaning; their purpose is simply to enable easy comparison of the heights of the columns. Hence the requirement is that the columns be of equal width. Optical illusions due to the use of different colours or fillings of the columns should also be strictly avoided.
Some general comments and
links from F-5 and towards year 7
Although the examples involving categorical data in Years F-5 often involve more than one categorical variable, this module marks a significant step forward in considering data on two categorical variables at the same time, including the possibility of association between them. This module also considers relative frequencies for the first time, and hence use of percentages of observations. These require care in presentations, with clear understanding and reporting of what the percentages refer to − that is, what are the totals of which the percentages are calculated.
This module also introduces for the first time, secondary sources of categorical data, and demonstrates the need for good public reporting and careful reading in understanding the many %’s that are quoted in digital media and elsewhere. Because students are encouraged to find information in digital media and elsewhere, they need also to start to be aware of misleading and incorrect graphs.
As in Years 4 and 5, the above examples again illustrate the extent of statistical thinking involved in the initial stages of an investigation in identifying the questions/issues and in planning and collecting the data. Although the focus is still on considering just the data as collected or given, the above examples also show that at least some indications of concepts of 'what do our data represent' and variation in data across samples, tend to arise naturally in everyday situations that are very familiar to young students.
The examples here focus on categorical variables. Year 7 builds on the introduction in Year 5 to measurement and large count data, to consider further graphical and summary representations and aspects of secondary sources of such data. Year 7 tends to focus on data on one variable at a time but in contexts that continue the development of experiential learning of the statistical data investigation process.
The Improving Mathematics Education in Schools (TIMES) Project 2009-2011 was funded by the Australian Government Department of Education, Employment and Workplace Relations.
The views expressed here are those of the author and do not necessarily represent the views of the Australian Government Department of Education, Employment and Workplace Relations.
© The University of Melbourne on behalf of the International Centre of Excellence for Education in Mathematics (ICE-EM), the education division of the Australian Mathematical Sciences Institute (AMSI), 2010 (except where otherwise indicated). This work is licensed under the Creative Commons Attribution-NonCommercial-NoDerivs 3.0 Unported License.
https://creativecommons.org/licenses/by-nc-nd/3.0/
![]()