
Variability in samples
We generally collect data from a sample to answer questions concerning the whole population. It is important to remember that different results can be obtained from a different sample.
Categorical data
Observations that fall into a number of distinct categories are known as categorical data. These occur everywhere in everyday life. For example:
- gender
- hair colour
- place of birth
- suburb of residence.
If we have census data, we can simply report percentages or proportions for a country. If we have sample data that are representative of some general situation, we use it to estimate proportions for the more general situation. However, for categorical data, we are interested in relative frequencies or proportions of the different categories.
Relative frequency of samples
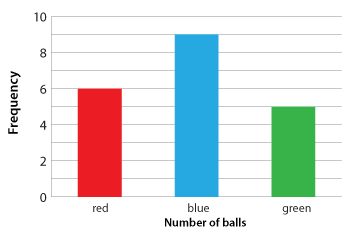
A large bin contains 200 red, blue and green balls, thoroughly mixed. We wish to estimate the number of red balls in the bin.
Twenty balls are drawn and their colour recorded. The categories are the colours. The population is the bin of balls, and the random sample of each ball consists of the 20 balls withdrawn.
The column graph gives a picture of the results.
One way of describing this data is through relative frequency or proportion.
Relative frequency (proportion) = \(
\dfrac{\text {frequency}}{\text {size of data set}}\), often expressed as a percentage.
In this case, the sample data set has 20 items.
Category |
Red | Blue | Green |
|---|---|---|---|
Frequency |
6 | 9 | 5 |
Relative frequency as a percentage |
30% | 45% | 25% |
Further investigation would be needed before we could make any prediction concerning the proportion of red balls in the bin.
 |
This publication is funded by the Australian Government Department of Education, Employment and Workplace Relations |
Terms of use |