Content
Areas above and below the axis
So far we have only considered functions \(f(x)\) whose graphs are above the \(x\)-axis, i.e., \(f(x) > 0\). But, of course, a graph can go below the \(x\)-axis. We now consider this situation.
When we computed the right-endpoint estimate, we approximated the area under the graph \(y=f(x)\) by rectangles of width \(\Delta x = \frac{1}{n} (b-a)\) and height \(f(x_j)\). The important point now is that, if \(f(x_j)\) is negative, then \(f(x_j) \; \Delta x\) is negative and we obtain the negative of the area of the rectangle. So when the graph of \(y=f(x)\) is below the \(x\)-axis, our method approximates the negative of the area between the graph and the \(x\)-axis.
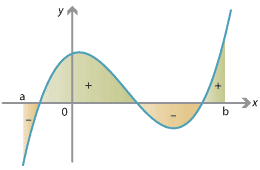
In regions where the graph of \(y=f(x)\) is above the \(x\)-axis (i.e., \(f(x)>0\)), a definite integral calculates the area between the graph and the \(x\)-axis. In regions where the graph is below the \(x\)-axis (i.e., \(f(x) < 0\)), the integral calculates the negative of the area between the graph and the \(x\)-axis. A general function \(f(x)\) is sometimes positive and sometimes negative, so the integral calculates the signed area, that is, the total area above the \(x\)-axis minus the total area below the \(x\)-axis.
Detailed description of diagram
The integral counts areas above/below the x-axis as positive/negative.
When we have a velocity–time graph \(y=v(t)\), the signed area has a natural interpretation. The regions where the graph is below the \(t\)-axis occur when \(v(t) < 0\), i.e., the velocity is negative and you are going backwards. When you are going backwards, your change in position is negative. Your total displacement is given by your total forwards movements minus your total backwards movements; these correspond to the regions above and below the \(t\)-axis. Thus signed area corresponds to displacement. The total area enclosed between the graph and the axis, on the other hand, is the total distance travelled, forwards and backwards.
In general, to find the total area enclosed between a graph and the axis, we find where the graph crosses the axis and compute the areas separately. See the following example.
Example
Detailed description of diagram
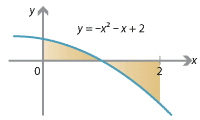
- Find \(\displaystyle\int_0^2 (-x^2 - x + 2) \; dx\).
- Find the area of the shaded region.
- If your velocity at time \(t\) is given by \(v(t) = -t^2 - t + 2\), then what is your displacement and your distance travelled between time \(t=0\) and \(t=2\)?
Solution
- \begin{align*} \int_0^2 (-x^2 - x + 2) \; dx &= \Bigg[ {-} \frac{1}{3} x^3 - \frac{1}{2} x^2 + 2x \Bigg]_0^2\\ &= \Big( {-} \frac{8}{3} - 2 + 4 \Big) - \big( 0 \big) = - \frac{2}{3}. \end{align*}
- The area is partly above and partly below the \(x\)-axis. Factorising
\[
-x^2 - x + 2 = -(x-1)(x+2),
\]
we find the \(x\)-intercept is at \(x=1\). Therefore the total area shown is
\begin{gather*} \int_0^1 (-x^2 - x + 2) \; dx - \int_1^2 (-x^2 - x + 2) \; dx \\ \qquad\qquad\begin{aligned}[t] &= \Bigg[ {-} \frac{1}{3} x^3 - \frac{1}{2} x^2 + 2x \Bigg]_0^1 - \Bigg[ {-} \frac{1}{3} x^3 - \frac{1}{2} x^2 + 2x \Bigg]_1^2 \\ &= \Bigg( \Big( {-} \frac{1}{3} - \frac{1}{2} + 2 \Big) - \big( 0 \big) \Bigg) - \Bigg( \Big( {-} \frac{8}{3} - 2 + 4 \Big) - \Big( {-} \frac{1}{3} - \frac{1}{2} + 2 \Big) \Bigg) \\ &= \Big( \frac{7}{6} - 0 \Big) - \Big( {-} \frac{2}{3} - \frac{7}{6} \Big) \\ &= \frac{7}{6} - \Big( {-} \frac{11}{6} \Big) = 3. \end{aligned} \end{gather*} - Your displacement is \(\int_0^2 v(t) \; dt\), which was computed in part 1, and is \(-\frac{2}{3}\) (i.e., you end up \(\frac{2}{3}\) backwards of where you started). Your total distance travelled is given by the area calculated in part 2, which is 3.
Beware! Computing integrals often involves many fractions, subtractions and negative signs, as in the above example! It is good practice to carefully bracket all terms, as shown.
Exercise 12
- Compute \(\displaystyle\int_{-2}^2 (x^3 - x) \; dx\).
- What is the total area enclosed between the graph of \(y=x^3 - x\) and the \(x\)-axis, from \(x=-2\) to \(x=2\)?
Next page - Content - Properties of the definite integral
| This publication is funded by the Australian Government Department of Education, Employment and Workplace Relations |
Contributors Term of use |