Content
The area under a graph
Suppose you have a function \(f\colon \mathbb{R} \to \mathbb{R}\) and its graph \(y=f(x)\). You want to find the area under the graph. For now we'll assume that the graph \(y=f(x)\) is always above the \(x\)-axis, and we'll estimate the area between the graph \(y=f(x)\) and the \(x\)-axis. We set left and right endpoints and estimate the area between those endpoints.
Below is the graph of \(f(x)=x^2 + 1\). We'll try to find the area under the graph \(y=f(x)\) between \(x=0\) and \(x=5\), which is shaded.
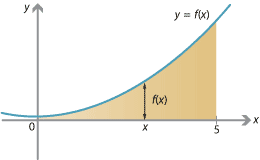
Detailed description of diagram
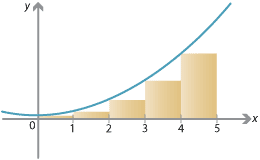
As a first approximation, we can divide the interval \([0,5]\) into five subintervals of width 1, i.e., \([0,1]\), \([1,2]\), \(\dots\), \([4,5]\), and consider rectangles as shown on the following graph.
Detailed description of diagram
As we can see, the total area of these rectangles is a rough approximation to the area we are looking for, but a clear underestimate. The total area of the rectangles is calculated in the following table.
| Interval | Width of rectangle | Height of rectangle | Area of rectangle |
|---|---|---|---|
| \([0,1]\) | 1 | \(f(0) = 0^2 + 1 = 1\) | 1 |
| \([1,2]\) | 1 | \(f(1) = 1^2 + 1 = 2\) | 2 |
| \([2,3]\) | 1 | \(f(2) = 2^2 + 1 = 5\) | 5 |
| \([3,4]\) | 1 | \(f(3) = 3^2 + 1 = 10\) | 10 |
| \([4,5]\) | 1 | \(f(4) = 4^2 + 1 = 17\) | 17 |
| Total area | 35 |
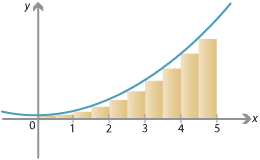
For a slightly better approximation, we can split the interval into 10 equal subintervals, each of length \(\frac{1}{2}\). Using the same idea, we have the rectangles shown on the following graph. We clearly have a better estimate, but still an underestimate.
Detailed description of diagram
| Interval | Width of rectangle | Height of rectangle | Area of rectangle |
|---|---|---|---|
| \([0,\frac{1}{2}]\) | \(\frac{1}{2}\) | \(f(0) = 0 + 1 = 1\) | \(\frac{1}{2}\) |
| \([\frac{1}{2},1]\) | \(\frac{1}{2}\) | \(f(\frac{1}{2}) = \frac{1}{4} + 1 = \frac{5}{4}\) | \(\frac{5}{8}\) |
| \([1,\frac{3}{2}]\) | \(\frac{1}{2}\) | \(f(1) = 1 + 1 = 2\) | 1 |
| \([\frac{3}{2},2]\) | \(\frac{1}{2}\) | \(f(\frac{3}{2}) = \frac{9}{4} + 1 = \frac{13}{4}\) | \(\frac{13}{8}\) |
| \([2,\frac{5}{2}]\) | \(\frac{1}{2}\) | \(f(2) = 4 + 1 = 5\) | \(\frac{5}{2}\) |
| \([\frac{5}{2},3]\) | \(\frac{1}{2}\) | \(f(\frac{5}{2}) = \frac{25}{4} + 1 = \frac{29}{4}\) | \(\frac{29}{8}\) |
| \([3,\frac{7}{2}]\) | \(\frac{1}{2}\) | \(f(3) = 9 + 1 = 10\) | 5 |
| \([\frac{7}{2},4]\) | \(\frac{1}{2}\) | \(f(\frac{7}{2}) = \frac{49}{4} + 1 = \frac{53}{4}\) | \(\frac{53}{8}\) |
| \([4,\frac{9}{2}]\) | \(\frac{1}{2}\) | \(f(4) = 16 + 1 = 17\) | \(\frac{17}{2}\) |
| \([\frac{9}{2},5]\) | \(\frac{1}{2}\) | \(f(\frac{9}{2}) = \frac{81}{4} + 1 = \frac{85}{4}\) | \(\frac{85}{8}\) |
| Total area | \(\frac{325}{8} = 40.625\) |
Splitting \([0,5]\) into more subintervals of smaller width, we can perform the same calculation and estimate the area. With more rectangles, the calculations become more tedious, but some results are given in the following table.
| Number of intervals | Width of each interval | Total area of rectangles |
|---|---|---|
| 5 | 1 | 35 |
| 10 | 0.5 | 40.625 |
| 50 | 0.1 | 45.425 |
| 100 | 0.05 | 46.04375 |
| 1 000 | 0.005 | 46.6041875 |
| 10 000 | 0.0005 | 46.66041875 |
| 100 000 | 0.00005 | 46.66604166875 |
| 1 000 000 | 0.000005 | 46.6666041666875 |
With more and more thinner and thinner rectangles, the areas appear to be converging towards a limit. It turns out, as we will see, that the limit is \(46 \frac{2}{3}\).
Screencast of interactive 4 ![]() ,
Interactive 4
,
Interactive 4 ![]()
The area under a curve is defined to be this limit. Although we have an intuitive notion of what area is, for a mathematically rigorous definition we need to use integration.
Next page - Content - Estimates of area
| This publication is funded by the Australian Government Department of Education, Employment and Workplace Relations |
Contributors Term of use |