Content
More graph sketching
Sketching graphs of polynomials
The module Polynomials introduces drawing the graphs of polynomials, but does not consider finding the coordinates of the points of inflexion. This is now possible.
By going through the following steps, we can find the important features of the graph of a given polynomial:
- the \(x\)- and \(y\)-intercepts
- stationary points
- where the graph is increasing and where it is decreasing
- local maxima and local minima
- behaviour as \(x\) becomes very large positive and very large negative
- points of inflexion.
Sometimes it is useful to find the coordinates of a few extra points on the graph.
Note. These steps are only a guide. Some flexibility in approach to these questions is desirable. In this module, we adhere to these steps as an aid to readability.
Example
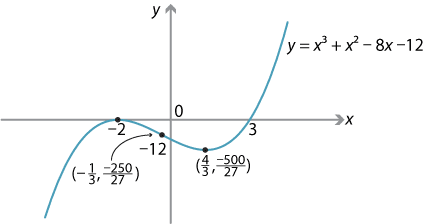
Sketch the graph of \(y=x^3+x^2-8x-12\).
Solution
- We first find the \(x\)-intercepts and \(y\)-intercepts.
When \(x=0\), we have \(y=-12\), and so the \(y\)-intercept is \(-12\).
When \(y=0\), \begin{align*} 0 &= x^3+x^2-8x-12 \\ &=(x+2)^2(x-3), \end{align*} so \(x=-2\) or \(x=3\). The \(x\)-intercepts are 3 and \(-2\). - The derivative is
\[
\dfrac{dy}{dx} = 3x^2+2x-8 = (3x-4)(x+2).
\]
So \(\dfrac{dy}{dx}=0\) implies \(x=-2\) or \(x=\dfrac{4}{3}\).
The coordinates of the stationary points are \((-2,0)\) and \((\dfrac{4}{3},-\dfrac{500}{27})\). - The graph of \(\dfrac{dy}{dx}\) against \(x\) is a parabola with a positive coefficient of \(x^2\). We can see:
- \(\dfrac{dy}{dx} = 0\) if and only if \(x=-2\) or \(x=\dfrac{4}{3}\)
- \(\dfrac{dy}{dx} > 0\) if and only if \(x<-2\) or \(x>\dfrac{4}{3}\)
- \(\dfrac{dy}{dx} < 0\) if and only if \(-2<x<\dfrac{4}{3}\).
So the graph is increasing on \((-\infty,-2) \cup (\dfrac{4}{3},\infty)\) and decreasing on \((-2,\dfrac{4}{3})\).
| Value of \(x\) | −2 | \(\dfrac{4}{3}\) | |||
|---|---|---|---|---|---|
| Sign of \(\dfrac{dy}{dx}\) | + | 0 | − | 0 | + |
| Slope of graph | \(\diagup\) | — | \(\diagdown\) | — | \(\diagup\) |
- From the investigation of the sign of \(\dfrac{dy}{dx}\), we see that there is a local maximum at \(x = -2\), and a local minimum at \(x = \dfrac{4}{3}\).
- As \(x \to \infty\), \(y \to \infty\), and as \(x \to -\infty\), \(y \to -\infty\).
- The second derivative is \[ \dfrac{d^2 y}{dx^2} = 6x+2. \] If \(x < -\dfrac{1}{3}\), then \(\smash{\dfrac{d^2 y}{dx^2}} < 0\), and if \(x > -\dfrac{1}{3}\), then \(\smash{\dfrac{d^2 y}{dx^2}} > 0\). There is an inflexion point where \(x = -\dfrac{1}{3}\).
Sketching graphs of other functions
The six steps used to help us sketch graphs of polynomials can be used to help sketch other graphs. In the Links forward section, we look briefly at graphs where there are local maxima or minima at which the function is not differentiable.
Example
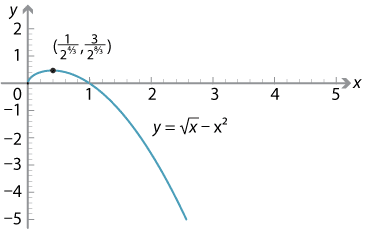
Sketch the graph of \(y = \sqrt{x} - x^2\), for \(x\geq 0\).
Solution
The first and second derivatives are
\[ \dfrac{dy}{dx} = \dfrac{1}{2\sqrt{x}} - 2x,\qquad \dfrac{d^2y}{dx^2} = -\dfrac{1}{4}x^{-\frac{3}{2}} - 2, \qquad\text{for } x>0. \]We follow the six steps for sketching polynomial graphs, which are still useful for this type of graph.
- We first find the \(x\)-intercepts: \begin{align*} \sqrt{x} - x^2 &= 0 \\ \sqrt{x}(1-x^{\frac{3}{2}}) &= 0, \end{align*} which gives \(x = 0\) or \(x = 1\).
- We find the stationary points by solving \(\dfrac{dy}{dx} = 0\): \begin{align*} \dfrac{1}{2\sqrt{x}} - 2x &= 0 \\ 1 &= 4x^\frac{3}{2} \\ x^\frac{3}{2} &= \dfrac{1}{4} \\ x &= \Bigl(\dfrac{1}{4}\Bigr)^{\frac{2}{3}}. \end{align*} So there is a stationary point at \(x = \bigl(\dfrac{1}{4}\bigr)^{\frac{2}{3}} = 2^{-\frac{4}{3}}\).
- If \(0 < x < 2^{-\frac{4}{3}}\), then \(\dfrac{dy}{dx} > 0\), and if \(x > 2^{-\frac{4}{3}}\), then \(\dfrac{dy}{dx} < 0\).
We can summarise this in a gradient diagram.
Hence, there is a local maximum at \(x = 2^{-\frac{4}{3}}\). The corresponding \(y\)-value is \begin{align*} y &= \bigl(2^{-\frac{4}{3}}\bigr)^{\frac{1}{2}} - \bigl(2^{-\frac{4}{3}}\bigr)^2 = 2^{-\frac{2}{3}} - 2^{-\frac{8}{3}} \\ &= 2^{-\frac{8}{3}}\bigl(2^2 - 1\bigr) = 3 \times 2^{-\frac{8}{3}}. \end{align*}Value of \(x\) \(2^{-\frac{4}{3}}\) Sign of \(\dfrac{dy}{dx}\) + 0 − Slope of graph \(\diagup\) — \(\diagdown\) - We can also determine that there is a local maximum at \(x = 2^{-\frac{4}{3}}\) by carrying out the second derivative test. When \(x = 2^{-\frac{4}{3}}\), \[ \dfrac{d^2y}{dx^2} = -\dfrac{1}{4}\bigl(2^{-\frac{4}{3}}\bigr)^{-\frac{3}{2}} - 2 = -\dfrac{1}{4}\bigl(2^2\bigr) - 2 = -3. \] Since \(\dfrac{dy}{dx} = 0\) and \(\dfrac{d^2y}{dx^2} < 0\) at \(x = 2^{-\frac{4}{3}}\), the point \(x = 2^{-\frac{4}{3}}\) is a local maximum.
- As \(x \to \infty\), \(y \to -\infty\). We do not consider \(x \to -\infty\), since the domain of the function is \([0,\infty)\).
- For all \(x > 0\), we have
\[
\dfrac{d^2y}{dx^2} = -\dfrac{1}{4}x^{-\frac{3}{2}} - 2 < 0.
\]
Hence, there are no points of inflexion.
We can now sketch the graph.
Example
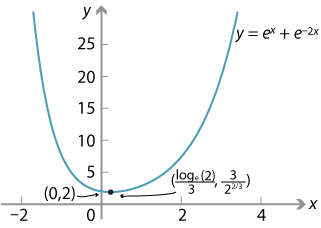
Sketch the graph of \(f(x) = e^x+e^{-2x}\).Solution
The domain of \(f\) is all real numbers. The first two derivatives of \(f\) are \begin{align*} f'(x) &= e^x-2e^{-2x} \\ f''(x) &= e^x+4e^{-2x}. \end{align*}- For all \(x\), we have \(e^x > 0\) and \(e^{-2x} > 0\), and therefore \(f(x) > 0\). Hence, there are no \(x\)-intercepts. We have \(f(0) = 2\), and so the \(y\)-intercept is 2.
- We find the stationary points by solving \(f'(x) = 0\): \begin{align*} e^x - 2e^{-2x} &= 0 \\ e^{3x} &= 2 \\ x &= \dfrac{1}{3}\log_e 2. \end{align*} So there is a stationary point at \(x = \dfrac{1}{3}\log_e 2\). The value of the function at this point is \(f(\dfrac{1}{3}\log_e 2) = 3 \times 2^{-\frac{2}{3}}\).
- If \(x<\dfrac{1}{3}\log_e 2\), the gradient is negative and the graph of \(y=f(x)\) is decreasing.
If \(x>\dfrac{1}{3}\log_e 2\), the gradient is positive and the graph of \(y=f(x)\) is increasing. - We have \(f''(x) = e^x+4e^{-2x} > 0\), for all \(x\). So there is a local minimum at \(x=\dfrac{1}{3}\log_e 2\).
- As \(x \to \infty\), \(f(x) \to \infty\), and as \(x \to -\infty\), \(f(x) \to \infty\).
- Since \(f''(x) = e^x+4e^{-2x} > 0\), for all \(x\), there are no inflexion points.
Example
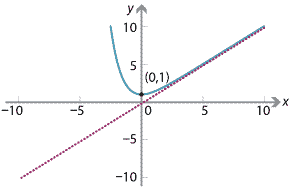
Sketch the graph of \(f(x) = e^{-x}+x\).Solution
The domain of \(f\) is all real numbers. The first two derivatives are \(f'(x) = -e^{-x}+1\) and \(f''(x) = e^{-x}\).- We have \(f(0) = 1\), so the \(y\)-intercept is 1. We will see later that there is a local minimum at \(x=0\). Indeed, the minimum value of the function occurs when \(x=0\). Hence, there are no \(x\)-intercepts.
- Solving \(f'(x) = 0\) gives \[ -e^{-x}+1 = 0 \ \iff\ e^{-x} = 1 \ \iff\ x = 0. \] Hence, there is a stationary point at \(x =0\).
- If \(x<0\), the gradient is negative and the graph of \(y=f(x)\) is decreasing.
If \(x>0\), the gradient is positive and the graph of \(y= f(x)\) is increasing. - We have \(f''(x) = e^{-x} > 0\), for all \(x\). Hence, there is a local minimum when \(x=0\).
- If \(x \to -\infty\), then \(f(x) \to \infty\). If \(x \to \infty\), then the line \(y=x\) is an asymptote, since \(e^{-x} \to 0\).
Exercise 7
Sketch the function \(f \colon (0,\infty) \to \mathbb{R}\) given by \(f(x) = x^2 \log_e x\).Maxima and minima at end points
It may be that the maximum or minimum value of a graph occurs at the endpoints of that graph. Here are two examples to illustrate the need to check endpoints when trying to find the maximum and minimum values of a function.
Example
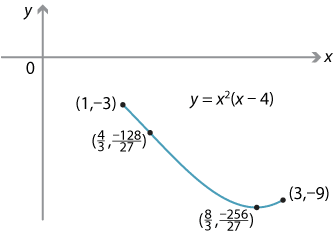
Sketch the graph of the function \(f \colon [1,3] \to \mathbb{R}\) given by \(f(x) = x^2(x-4)\), and find the maximum and minimum values of the function.
Solution
If \(f(x) = 0\), then \(x=0\) or \(x=4\), which are outside the domain. Therefore the graph has no \(x\)-intercepts.
We next find the derivative and the second derivative of \(f\):
\begin{align*} f'(x) &= 3x^2-8x = x(3x-8) \\ f''(x) &= 6x-8. \end{align*}Hence, there is a stationary point at \(x=\dfrac{8}{3}\), and a point of inflexion at \(x=\dfrac{4}{3}\).
To determine if \(x=\dfrac{8}{3}\) is a local maximum or minimum, we use the second derivative test:
\[ f''\Bigl(\dfrac{8}{3}\Bigr) = 8 > 0, \]and hence there is a local minimum at \(x=\dfrac{8}{3}\).
We now find the values of \(f\) at the two endpoints and the local minimum:
\[ f\Bigl(\dfrac{8}{3}\Bigr) = -\dfrac{256}{27},\qquad f(1) = -3,\qquad f(3) = -9. \]Hence, the maximum value of \(f\) is \(-3\), and it occurs when \(x=1\). The minimum value of \(f\) is \(-\dfrac{256}{27}\), and it occurs when \(x=\dfrac{8}{3}\).
Example
Define \(f \colon [-7,6] \to \mathbb{R}\) by \(f(x) = 3x^4+8x^3-174x^2-360x\). Find the maximum and minimum values of the function.
Solution
The first and second derivatives are
\begin{align*} f'(x) &= 12x^3+24x^2-348x-360 \\ &= 12(x^3+2x^2-29x-30) = 12(x+1)(x-5)(x+6) \\ f''(x) &= 36x^2+48x-348 = 12(3x^2+4x-29). \end{align*}So \(f'(x)=0\) implies \(x = 5\) or \(x = -1\) or \(x=-6\). There are stationary points at these three values. We use the second derivative test:
\[ f''(5) = 792 > 0,\qquad f''(-1) = -360 < 0,\qquad f''(-6) = 660 > 0. \]Hence, there is a local minimum at \(x=5\), a local maximum at \(x=-1\), and a local minimum at \(x=-6\).
We have the following points on the graph:
- the left endpoint \((-7,-1547)\)
- a local minimum \((-6,-1944)\)
- a local maximum \((-1,181)\)
- a local minimum \((5,-3275)\)
- the right endpoint \((6,-2808)\).
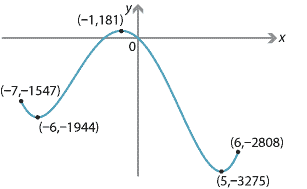
The maximum value of the function \(f\) is \(181\), which occurs at \(x=-1\), and the minimum value of \(f\) is \(-3275\), which occurs at \(x=5\).
Exercise 8
Sketch the graph of the function \(f \colon [-1,2] \to \mathbb{R}\) given by \(f(x) = x^2(x+4)\), and find the maximum and minimum values of this function.
Next page - Content - Maxima and minima problems
| This publication is funded by the Australian Government Department of Education, Employment and Workplace Relations |
Contributors Term of use |