Content
Graphing the trigonometric functions
In the module Trigonometric functions (Year 10), we drew the graphs of the sine and cosine functions, marking the \(\theta\)-axis in degrees. Using \({\sin 30^\circ = 0.5}\) and \({\sin 60^\circ\approx 0.87}\), we drew up a table of values and plotted them.
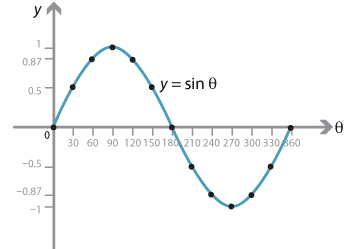
Detailed description of diagram
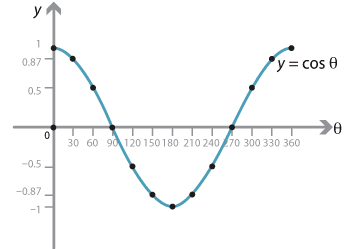
Detailed description of diagram
These graphs are often referred to by physicists and engineers as sine waves.
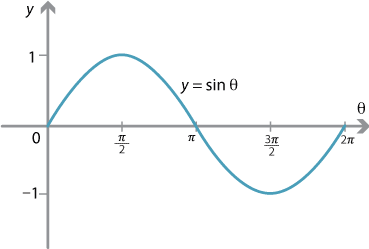
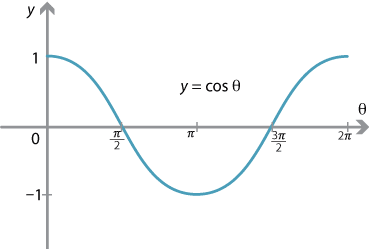
From now on, we will use radians as the unit on the \(\theta\)-axis and so we have the following graphs for sine and cosine.
Symmetries of the sine graph
The graph of \(y = \sin \theta\) has many interesting symmetries.
The model employing the unit circle helps to elucidate these. The sine of the angle \(\theta\) is represented by the \(y\)-value of the point \(P\) on the unit circle. Since \(\sin \theta = \sin (\pi - \theta)\), we can mark two equal intervals on the following sine graph.
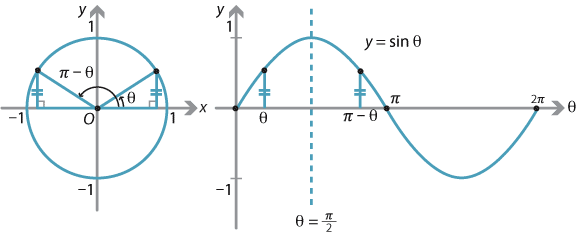
Detailed description of diagram
Hence, between 0 and \(\pi\), the graph of \(y = \sin \theta\) is symmetric about \(\theta = \dfrac{\pi}{2}\).
Similarly, between \(\pi\) and \(2\pi\), the graph is symmetric about \(\theta = \dfrac{3\pi}{2}\).
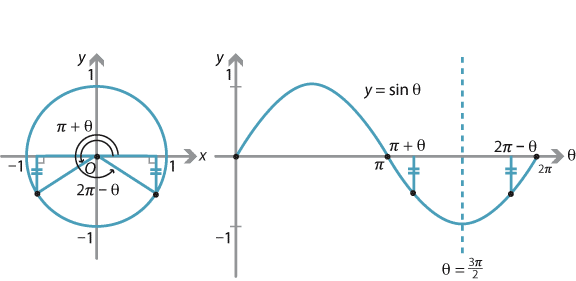
Detailed description of diagram
Finally, the graph possesses a rotational symmetry about \(\theta = \pi\) as the following diagram demonstrates.
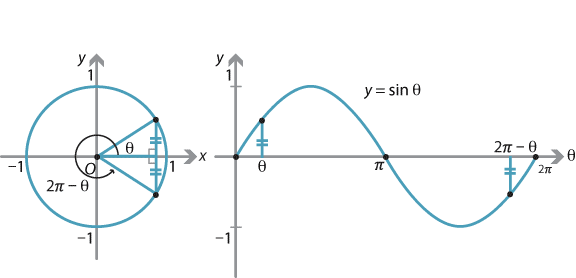
Detailed description of diagram
All these observations are summarised by the following diagram. This symmetry diagram illustrates the related angle and the quadrant sign rules, as well as the symmetries discussed above.
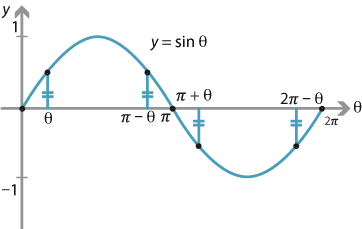
Symmetries of the sine graph.
Detailed description of diagram
The extended sine graph
The values of sine repeat as we move through an angle of \(2\pi\), that is,
\[ \sin (2\pi + x) = \sin x. \]We say that the function \(y = \sin x \) is periodic with period \(2\pi\).
Thus, the graph may be drawn for angles greater than \(2\pi\) and less than 0, to produce the full (or extended) graph of \(y = \sin x\).
The graph of \(y=\sin x\) from 0 to \(2\pi\) is often referred to as a cycle.
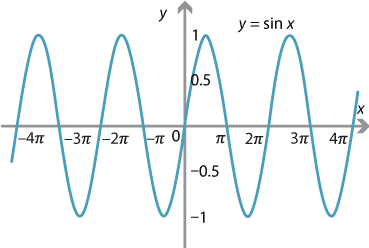
Detailed description of diagram
Note that the extended sine graph has even more symmetries. There is a translation (by \(2\pi\)) symmetry, a reflection symmetry about any odd multiple of \(\dfrac{\pi}{2}\) and a rotational symmetry about any even multiple of \(\dfrac{\pi}{2}\).
Exercise 16
Sketch the graph of \(y=\cos x\), for \(-4\pi \leq x \leq 4\pi\).
Period, amplitude and phase shift
The more general form for the sine graph is
\[ y=A\sin(nx + \alpha), \] where \(A\), \(n\) and \(\alpha\) are constants and \(A > 0\). What is the effect of varying the values of \(A\), \(n\) and \(\alpha\)?Changing \(\alpha\) shifts the graph along the \(x\)-axis. If \(\alpha>0\), then the basic sine graph moves to the left and, if \(\alpha<0\), it moves to the right. This is sometimes referred to as a phase shift.
For example, we can see from the following graph that \(\sin \bigl(x - \dfrac{\pi}{2}\bigr) = -\cos x\).
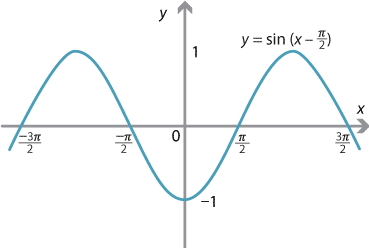
Detailed description of diagram
Changing the value of \(A\) stretches the \(y\)-values from the \(x\)-axis. The sine graph \(y=\sin x\) has a maximum of 1 and a minimum of \(-1\). Hence the graph of \(y=A\sin x\) (for a fixed \(A>0\)) has a maximum of \(A\) and a minimum of \(-A\). The number \(A\) is referred to as the amplitude. Trigonometric graphs are used to represent the current in an AC circuit over a time period, and so the amplitude gives the maximum and minimum values of the current.
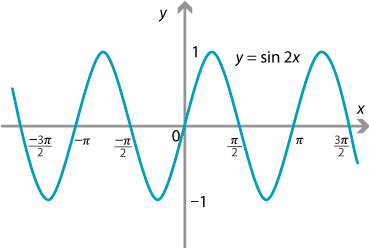
Changing the value of \(n\) stretches the graph in the \(x\)-direction. The graph of \(y=\sin x\), for \(0 \leq x \leq 2\pi\), represents one cycle of the sine curve, and we say that the period of the graph is \(2\pi\). This means that one cycle of the graph occurs over an interval of \(2\pi\). Changing \(n\) alters the period of the graph. For example, if we draw the graph of \(y=\sin 2x\), for \(0 \leq x \leq 2\pi\), we obtain two cycles of the graph and so the period becomes \(\pi\), since one cycle of the graph occurs over an interval of length \(\pi\).
Detailed description of diagram
In general, the period of the graph of \(y=\sin nx\) is given by
\[ \text{Period} = \dfrac{2\pi}{n}. \]Example
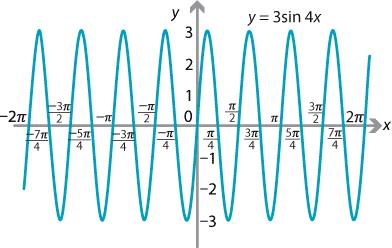
Sketch the graph of \(y=3\sin4x\), for \(-2\pi \leq x \leq 2\pi\).
Solution
The amplitude of the graph is 3 and the period is \(\dfrac{2\pi}{4}= \dfrac{\pi}{2}\).
The easiest way to draw the graph is to draw one cycle of a sine curve, with amplitude 3, and mark the end point as \(\dfrac{\pi}{2}\). We can then extend the graph using periodicity to the interval \(-2\pi \leq x \leq 2\pi\).
Cosine graphs of the form \(y = A\cos(nx + \alpha)\) can be drawn by following the principles outlined above for sine graphs.
Exercise 17
Sketch the graph of \(y=2\cos 3x\), for \(-3\pi \leq x \leq 3\pi\).
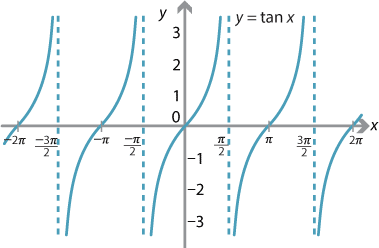
The graph of \(\tan x\)
The function \(\tan x\) has a very different kind of graph to those for the sine and cosine functions. The period of \(\tan x\) is \(\pi\), rather than \(2\pi\), and the amplitude is not defined. The tangent function is not defined at \(x=\pm \dfrac{\pi}{2}\), nor at any odd integer multiple of these values.
As \(x\) approaches \(\dfrac{\pi}{2}\) from the left, the value of \(\tan x\) increases without bound. Since \(\tan\) is an odd function, as \(x\) approaches \(-\dfrac{\pi}{2}\) from the right, \(\tan x\) decreases without bound.
The period of the graph of \(y = \tan nx\) is given by \(\dfrac{\pi}{n}\).
| This publication is funded by the Australian Government Department of Education, Employment and Workplace Relations |
Contributors Term of use |