Content
Geometric transformations of graphs of functions
The graph of a function can be changed to produce the graph of a new function using:
- vertical or horizontal translations
- reflections in either axis
- stretching from either axis.
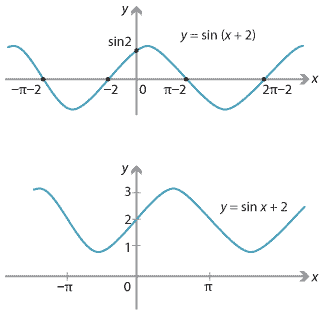
For example, if \(f(x) = \sin x\) and \(g(x) = x+2\), then
\[ (f\circ g)(x) = \sin(x+2) \qquad\text{and}\qquad (g\circ f)(x) = \sin(x) + 2. \]Both of these can be thought of as translations of \(f(x) = \sin x\), so clearly we cannot talk about the translation of a function by 2.
On the other hand, the image of the graph of a function under a rotation is usually not the graph of a function. Rotations of graphs of quadratic functions are discussed briefly in the module Quadratics .
Translations
Vertical translations in general
Consider the graph of \(y_1 = f(x)\) and the graph of \(y_2 = f(x)+7\), as shown in the following diagram.
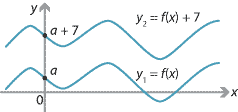
We call \(y_2 = f(x)+7\) the vertical translation 7 units up of \(y_1 = f(x)\). Similarly, \(y_3 = f(x)-7\) is the vertical translation 7 units down of \(y_1 = f(x)\).
Vertical translations of parabolas
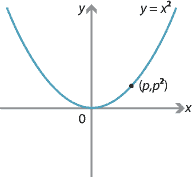
The standard parabola \(y=x^2\) in shown on the left in the following diagram. We can describe each point on the parabola in terms of a parameter \(p\); the corresponding point is \((p,p^2)\).
 |
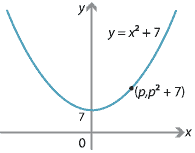 |
If \(y=x^2\) is translated 7 units up, we obtain \(y=x^2+7\), which is also parametrised by \(p\); the corresponding point is \((p,p^2+7)\).
Horizontal translations of parabolas
Suppose that the standard parabola \(y=x^2\) is translated 3 units to the right. The vertex \((0,0)\) is moved to \((3,0)\), which is the vertex of the parabola \(y=(x-3)^2\). Their graphs are as follows.
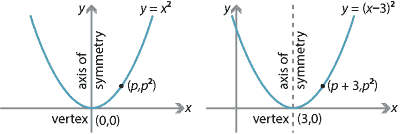
Clearly, the point \((p,p^2)\) is moved to the point \((p+3,p^2)\). If \(x=p+3\) and \(y=p^2\), then \(y=(x-3)^2\). In the same way, a translation 5 units to the left maps \(y=x^2\) to \(y=(x+5)^2\), with the point \((p,p^2)\) moved to the point \((p-5,p^2)\).
Horizontal translations in general
Now we consider what happens to the graph of an arbitrary function \(y = f(x)\) when it is translated \(a\) units to the right.
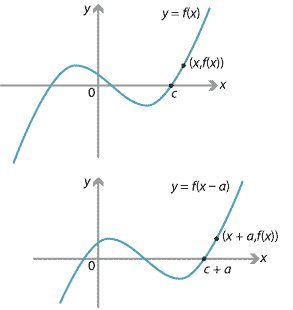
The translation moves the point \((x,y)\) to the point \((x+a,y)\). We can view this translation as a mapping from the coordinate plane to itself, given by
\[ (x,y) \mapsto (x',y'), \qquad\text{where}\quad x' = x + a \quad\text{and}\quad y' = y. \]Here we have \(x = x' - a\) and \(y = y'\). So the graph \(y = f(x)\) maps to \(y' = f(x' - a)\). That is, \(y = f(x)\) maps to \(y = f(x - a)\).
Example
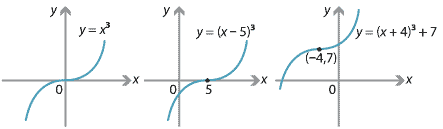
Consider the graph of \(y=x^3\).
- If the graph is translated 5 units to the right, then what are the coordinates of the inflexion point and what is the equation of the image?
- If the graph is translated 4 units to the left and 7 units up, then what are the coordinates of the inflexion point and what is the equation of the image?
Solution
- The point of inflexion \((0,0)\) is translated to \((5,0)\). The equation of the image of the graph is \(y=(x-5)^3\).
- The point of inflexion \((0,0)\) is translated to \((-4,7)\). Translating the graph \(y=x^3\) to the left by 4 units gives \(y=(x+4)^3\). Then translating 7 units up yields \(y=(x+4)^3+7\).
General translations
A general translation \(T\) of the plane is given by
\[ T(x,y)=(x+a,y+b), \]for some real numbers \(a,b\). In particular, we have \(T(0,0)=(a,b)\). Clearly, this mapping is the composite of a horizontal translation through \(a\) and a vertical translation through \(b\). Thus, for example, it maps the graph of \(y=x^2\) to the graph of \(y=(x-a)^2+b\).
Exercise 3
Find the translation which maps the graph of \(y=x^2\) to \(y=x^2+4x+10\). Sketch the graph of \(y=x^2+4x+10\).
Summary for translations
The following table gives the image of the graph of \(y=f(x)\) under various translations, with \(a\) and \(b\) positive constants.
| Translation | Image |
|---|---|
| \(a\) units up | \(y=f(x)+a\) |
| \(a\) units down | \(y=f(x)-a\) |
| \(b\) units to the right | \(y=f(x-b)\) |
| \(b\) units to the left | \(y=f(x+b)\) |
| \(a\) units up and \(b\) units to the right | \(y=f(x-b)+a\) |
| \(a\) units down and \(b\) units to the left | \(y=f(x+b)-a\) |
We note that sometimes:
- 'up' is expressed as 'in the positive direction of the \(y\)-axis'
- 'down' is expressed as 'in the negative direction of the \(y\)-axis'
- 'to the right' is expressed as 'in the positive direction of the \(x\)-axis'
- 'to the left' is expressed as 'in the negative direction of the \(x\)-axis'.
Reflections
Assume we are given a line \(l\) in the plane. We can reflect any point \(P\) in the line \(l\) to obtain a point \(Q=R_l(P)\), as shown in the following diagram.
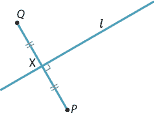
The point \(Q\) is found by dropping a perpendicular from \(P\) to \(l\), which meets \(l\) at \(X\). We take \(Q\) on this perpendicular such that \(PX = XQ\), with \(Q \neq P\) unless \(P\) lies on \(l\). This describes a mapping \(R_l\) from the plane \(\mathbb{R}^2\) to itself. It is an involution, meaning that if you perform the mapping twice you get the identity.
There are three important special cases:
- when \(l\) is the \(x\)-axis, \(y=0\)
- when \(l\) is the \(y\)-axis, \(x=0\)
- when \(l\) is the line \(y=x\).
The third case is important when determining inverses of functions, and will be discussed in the next section of this module.
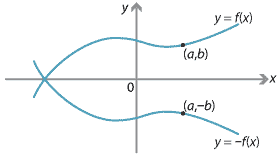
Reflection in the \(x\)-axis
Reflection in the \(x\)-axis maps the point \((a,b)\) to the point \((a,-b)\). Thus, if we consider the graph of \(y=f(x)\) and reflect it in the \(x\)-axis, we obtain the graph of \(y=-f(x)\).
For example, the standard parabola \(y=x^2\) is reflected to the parabola \(y=-x^2\). By applying suitable horizontal and vertical translations to \(y=-x^2\), we can obtain any parabola of the form \(y=-x^2+ax+b\).
Reflection in the \(y\)-axis
Reflection in the \(y\)-axis maps the point \((a,b)\) to the point \((-a,b)\). Thus, if we consider the graph of \(y=f(x)\) and reflect it in the \(y\)-axis, we obtain the graph of \(y=f(-x)\).
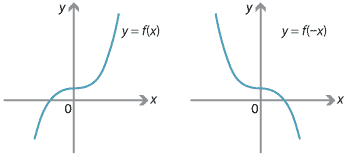
For example, the graph \(y=x^2\) is mapped to itself, and the graph \(y=x^3\) is mapped to \(y=-x^3\).
Summary for reflections in an axis
We summarise reflections of a function \(y=f(x)\) in the axes in the following table.
| Reflection | Image |
|---|---|
| Reflection in the \(x\)-axis | \(y=-f(x)\) |
| Reflection in the \(y\)-axis | \(y=f(-x)\) |
Exercise 4
- Show that a function \(f(x)\) is even if and only if the graph of \(y=f(x)\) is mapped to itself by reflection in the \(y\)-axis.
- Show that a function \(y=f(x)\) is odd if and only if the graph of \(y=f(x)\) is mapped to itself by the composition of the reflections in the two coordinate axes.
Isometries
An isometry of the plane is a transformation which preserves distances between points. Isometries include rotations, translations, reflections, glide reflections and the identity map. In fact, it can be proved that every isometry can be obtained as a composition of at most three reflections.
Isometries are sometimes also called congruence transformations. Two figures that can be transformed into each other by an isometry are said to be congruent.
So far in this section, we have looked at translations and reflections in the axes. Now we consider a family of transformations which are not isometries: the transformations which are 'stretches' from one of the axes.
Some transformations which are not isometries
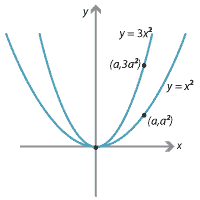
Stretches from the \(x\)-axis
The mapping \((x,y) \mapsto (x,3y)\) is called a stretch from the \(x\)-axis. Under this mapping, the point \((a,a^2)\) on the graph of \(y = x^2\) is sent to the point \((a,3a^2)\) on the graph of \(y = 3x^2\). This is shown in the following diagram.
We can describe this mapping as
\[ (x,y) \mapsto (x',y'), \qquad\text{where}\quad x'=x \quad\text{and}\quad y'=3y. \]Thus \(x=x'\) and \(y=\dfrac{y'}{3}\), and so the graph of \(y = x^2\) maps to \(\dfrac{y'}{3}=(x')^2\). That is, \(y=x^2\) maps to \(y=3x^2\).
Stretches from the \(y\)-axis
The mapping \((x,y) \mapsto (3x,y)\) is called a stretch from the \(y\)-axis. We can describe this mapping as \[ (x,y) \mapsto (x',y'), \qquad\text{where}\quad x'=3x \quad\text{and}\quad y'=y. \] Thus \(x=\dfrac{x'}{3}\) and \(y=y'\), and so the graph of \(y = x^2\) maps to \(y'= \Bigl(\dfrac{x'}{3}\Bigr)^2\). That is, \(y=x^2\) maps to \(y = \dfrac{x^2}{9}\).
Summary for stretches from the axes
We have seen that \((x,y) \mapsto (x,3y)\) under a stretch from the \(x\)-axis by the factor 3. In general, the mapping \((x,y) \mapsto (x,ky)\) is the stretch from the \(x\)-axis by the factor \(k\), where \(k>0\). Similarly, the mapping \((x,y) \mapsto (kx,y)\) is the stretch from the \(y\)-axis by the factor \(k\), where \(k>0\). We summarise this in the following table.
| Stretch | Transformation | Image |
|---|---|---|
| Stretch from \(x\)-axis by the factor \(k\), for \(k > 0\) | \((x,y) \mapsto (x,ky)\) | \(y=kf(x)\) |
| Stretch from \(y\)-axis by the factor \(k\), for \(k > 0\) | \((x,y) \mapsto (kx,y)\) | \(y=f\Bigl(\dfrac{x}{k}\Bigr)\) |
Note. The composition of these two stretches gives a transformation \((x,y) \mapsto (kx,ky)\). This is called a dilation. A dilation is an example of a similarity transformation.
Next page - Content - Functions and their inverses
| This publication is funded by the Australian Government Department of Education, Employment and Workplace Relations |
Contributors Term of use |