
Content description
Graph simple non-linear relations with and without the use of digital technologies and solve simple related equations (ACMNA296)
Source: Australian Curriculum, Assessment and Reporting Authority (ACARA)
Graphs of quadratics
Consider the relationship given by y = x\(^2\). This is not a linear relationship because x is raised to the power 2. First, we complete a table of values.
| \(x\) | −3 | −2 | −1 | 0 | 1 | 2 | 3 |
|---|---|---|---|---|---|---|---|
| \(y = x^2\) | 9 | 4 | 1 | 0 | 1 | 4 | 9 |
We then plot the corresponding points and join them with a smooth curve to obtain the graph below:
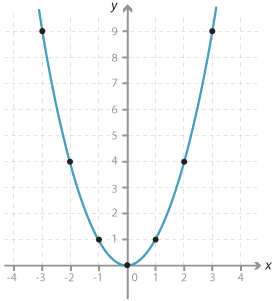
This graph is called a parabola. The point (0, 0) is called the vertex or turning point of the parabola. The vertex corresponds to the minimum value of y, since x\(^2\) is positive except when x = 0.
The graph is symmetrical about the y-axis. This line is called the axis of symmetry.
Example 1
Plot the graph of y = 2 x\(^2\) − 1 for −2 ≤ x ≤ 2. Find the axis of symmetry and the coordinates of the vertex.
Solution
The table of values is shown:
| \(x\) | –2 | –1 | 0 | 1 | 2 |
|---|---|---|---|---|---|
| \(y = 2 x^2 - 1\) | 7 | 1 | –1 | 1 | 7 |
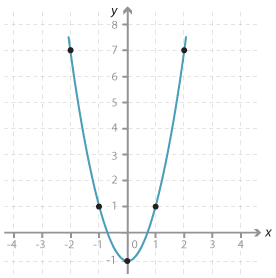
Notice that the y-values are the same for x = −1 and x = 1. The equation of the axis of symmetry is x = 0. When x = 0, y = −1, so the vertex has coordinates (0, −1).
Example 2
Plot the graph of y = x\(^2\) − 4 for −3 \(\le\) x \(\le\) 3. Give the coordinates of the vertex, the equation of the axis of symmetry and the coordinates of the x-intercepts and the y-intercept.
Solution
The table of values is shown:
| \(x\) | −3 | −2 | −1 | 0 | 1 | 2 | 3 |
|---|---|---|---|---|---|---|---|
| \(y = x^2 - 4\) | 5 | 0 | −3 | −4 | −3 | 0 | 5 |
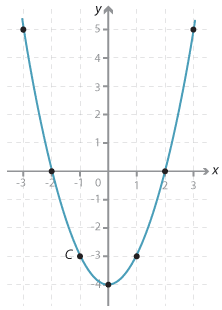
The vertex has coordinates (0, −4).
The equation of axis of symmetry is x = 0.
The coordinates of the y-intercept are (0, −4).
The coordinates of the x-intercepts are (−2, 0) and (2, 0).
 |
This publication is funded by the Australian Government Department of Education, Employment and Workplace Relations |
Terms of use |